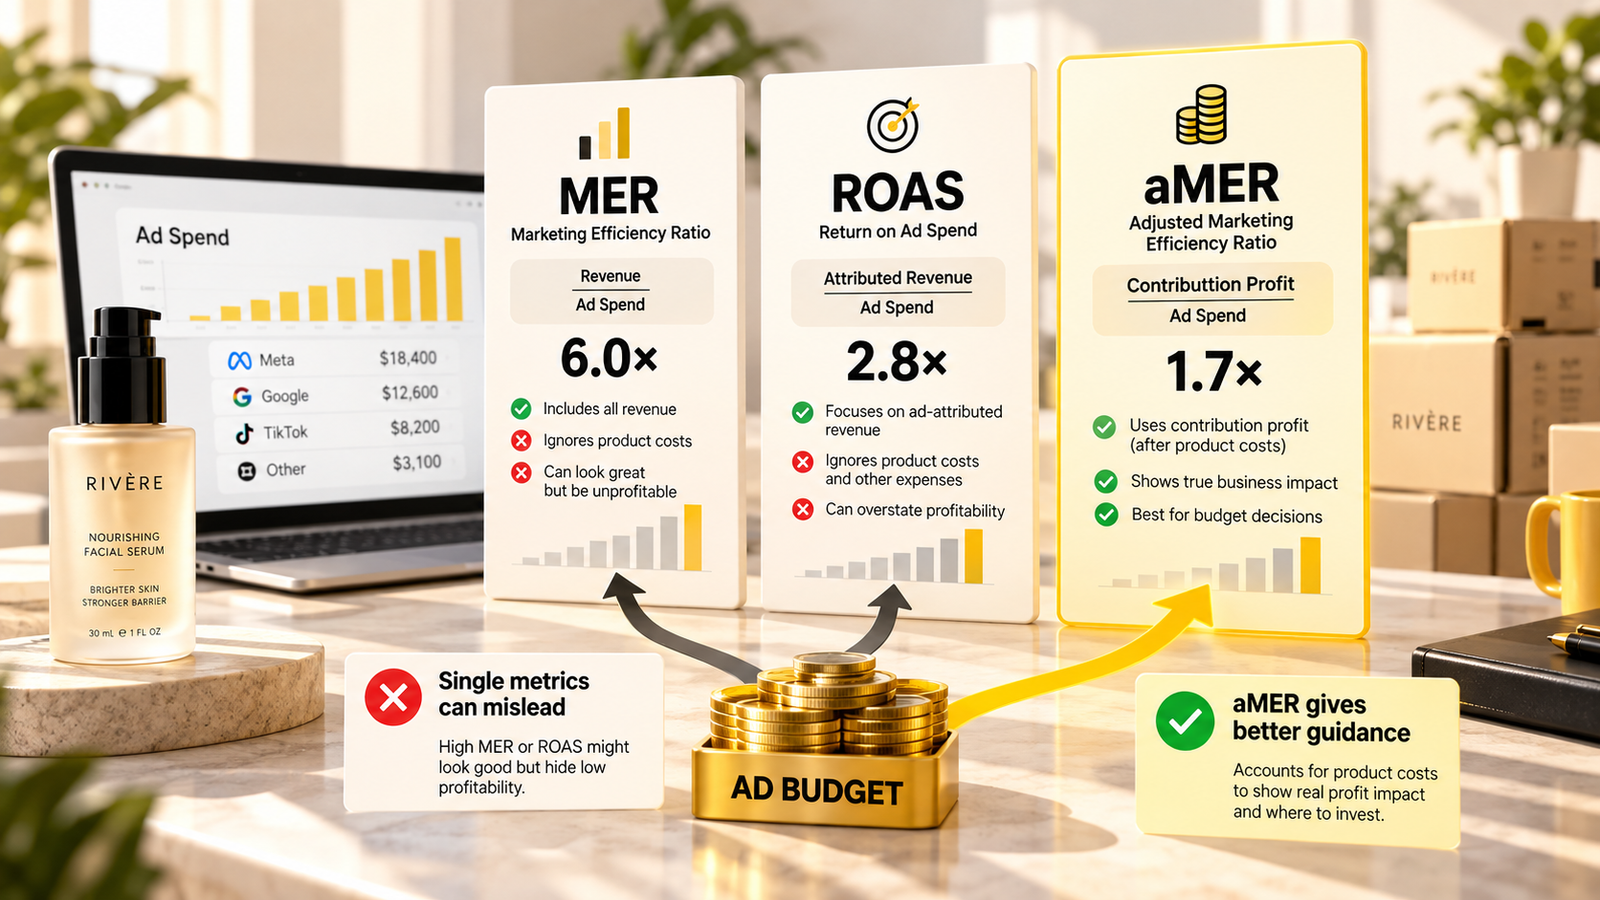
- ROAS is what each ad platform claims. MER is total revenue divided by total marketing spend. aMER is revenue from new customers divided by total marketing spend.
- MER is the business number, aMER is the growth number, and platform ROAS is an optimisation signal inside each platform. Using ROAS to set total budget is the most common mistake we see.
- MER can stay flat for a year while aMER falls, because returning customers cover for weak acquisition. That is how plateaus start.
- Your break-even aMER is 1 divided by the contribution margin on a first order. Most brands do not know this number, so they cannot tell whether acquisition is paying.
- Use net revenue without sales tax, shipping income treated consistently, and gift cards counted when redeemed. Getting the inputs wrong can move MER by 10% or more.
In this article
The board deck has a line that has not changed in a year: "MER stable at 4x." Revenue is inching up, marketing spend is inching up, and the ratio between them holds. The founder reads it as proof that the growth machine is healthy. Six months later, total revenue starts to fall, and nobody can explain why a business with a stable 4x MER is suddenly shrinking.
The explanation was sitting in the same data the whole time. MER was stable because loyal customers were buying more every month. The number underneath it, revenue from new customers per marketing dollar, had fallen by almost 40%. One ratio said everything was fine. A second ratio, built from the same Shopify export, said acquisition was failing.
Ask five DTC founders what their ROAS is and you will get five confident answers. Ask them whether last month's ad spend made money and most will pause. The reason is simple: ROAS measures what an ad platform can connect to its ads, not what the business earned from spending.
Three numbers, read together, answer the real question. This article explains each one, how to calculate it without the usual input mistakes, and how to use them to set next month's budget.
| Metric | Formula | What it tells you | Who owns it |
|---|---|---|---|
| ROAS | Revenue a platform attributes to its ads / that platform's spend | Which campaigns and ads work better than others inside one platform | Media buyer |
| MER | Total net revenue / total marketing spend | How efficiently the whole business turns marketing into sales | Founder or CFO |
| aMER | Net revenue from new customers / total marketing spend | Whether marketing is buying new customers at a sustainable price | Founder |
Why platform ROAS cannot set your budget
Each platform counts the sales it can link to its own ads, under its own rules. Meta counts clicks and some views and engagements. Google counts clicks, including on your own brand name. Klaviyo counts opens. None of them check with each other, so the same order is often claimed two or three times.
Add up what every platform claims and compare it with Shopify. In most accounts the platforms together claim more than the business actually sold to the people they reached, sometimes more than total revenue. That is not fraud. It is the result of every tool grading its own work. We look at the email side of this in Klaviyo says email drives 30% of your revenue.
ROAS is still useful. Inside Meta, it tells you which ad set or creative is doing better relative to the others. It just cannot tell you how much the business should spend in total.
Getting the inputs right
Most MER calculations we see are off by 5% to 15% before anyone reads them, because of what goes into the top and bottom of the ratio.
| Input | Include | Leave out | Why it matters |
|---|---|---|---|
| Revenue | Gross sales minus discounts and returns | Sales tax collected | Sales tax is money you hold for the state. Shopify's "total sales" includes it |
| Shipping charged to customers | Either always in or always out | Switching between the two | Consistency matters more than the choice |
| Gift cards | Revenue when redeemed | Revenue when sold | A gift card sold is a liability until used |
| Marketing spend | All paid media, affiliate and influencer fees, agency media fees | Email platform subscription, salaries | The test: was the spend meant to find or convert customers? |
| Amazon | A separate MER, or a combined one if ads drive both | Mixing Amazon revenue with DTC-only spend | Otherwise Amazon sales flatter DTC MER |
Your break-even aMER
This is the most useful number most founders have never calculated. To get it, you need the contribution margin on a first order: what is left from the average first order after the costs of making and delivering it.
| Line (per average first order) | Amount |
|---|---|
| Net revenue after discount | $68.00 |
| Landed product cost | $17.00 |
| Pick, pack and shipping | $9.50 |
| Payment processing | $2.30 |
| Expected returns and refunds cost | $3.20 |
| Contribution before marketing | $36.00 |
| First-order contribution margin | 52.9% |
| Break-even aMER | 1.89x |
Illustrative numbers. First orders often carry a welcome discount, so their margin is lower than your average order's margin.
If this brand's aMER is 1.89x, every dollar of marketing is exactly paid back by the first order. Above it, acquisition makes money on day one. Below it, the brand is relying on repeat orders to pay for acquisition, which is fine as long as you know it and have the cash to wait.
Your target aMER with payback
Most brands can afford to run below break-even on the first order if customers come back. The question is how quickly. If you know how much contribution an average new customer adds in repeat orders over 90 or 180 days, you can set a target that pays back inside that window.
| Payback window | Repeat contribution per new customer | Total contribution per new customer | aMER needed to pay back in window |
|---|---|---|---|
| First order only | $0 | $36.00 | 1.89x |
| 90 days | $9.00 | $45.00 | 1.51x |
| 180 days | $16.00 | $52.00 | 1.31x |
Illustrative. aMER needed = first-order revenue ($68) / total contribution in the window.
aMER needed to pay back acquisition within each window (worked example)
Cash decides the window. A shorter runway needs a higher aMER target.
| Label | aMER needed |
|---|---|
| First order only | 1.89x |
| 90 days | 1.51x |
| 180 days | 1.31x |
A brand with $150,000 in the bank and a supplier who wants payment 60 days before goods arrive should not pick a 180-day payback target. Cash decides the window, not ambition.
How MER hides a plateau
Here is the pattern that shows up again and again in brands that stall between $100k and $1M a month. MER looks steady. Nobody worries. Underneath, the mix is changing.
| Month | Marketing spend | New customer revenue | Returning revenue | MER | aMER |
|---|---|---|---|---|---|
| January | $50,000 | $120,000 | $130,000 | 5.0x | 2.40x |
| February | $52,000 | $114,000 | $140,000 | 4.9x | 2.19x |
| March | $55,000 | $110,000 | $150,000 | 4.7x | 2.00x |
| April | $55,000 | $101,000 | $158,000 | 4.7x | 1.84x |
| May | $58,000 | $96,000 | $165,000 | 4.5x | 1.66x |
| June | $60,000 | $90,000 | $172,000 | 4.4x | 1.50x |
Illustrative. Total revenue grew from $250k to $262k. New customer revenue fell 25%.
MER and aMER by month for the illustrative brand above
From April onwards, every new customer lost money on the first order. MER barely moved.
| Label | MER | aMER |
|---|---|---|
| Jan | 5x | 2.4x |
| Feb | 4.9x | 2.19x |
| Mar | 4.7x | 2x |
| Apr | 4.7x | 1.84x |
| May | 4.5x | 1.66x |
| Jun | 4.4x | 1.5x |
Monthly revenue by customer type, $K (illustrative)
| Label | Returning customers | New customers |
|---|---|---|
| Jan | $130K | $120K |
| Feb | $140K | $114K |
| Mar | $150K | $110K |
| Apr | $158K | $101K |
| May | $165K | $96K |
| Jun | $172K | $90K |
The founder sees revenue up 5% and MER drifting from 5.0x to 4.4x, which feels like normal scaling. The business is actually buying 25% less new customer revenue for 20% more spend. Returning customers are carrying the numbers. They will not grow forever, and when they plateau, the whole business plateaus with them, usually six to nine months after aMER started to slide.
New customer CAC and first-order profit
aMER has a partner that is easier to explain to a team: new customer CAC.
Using the numbers above, if the brand spent $60,000 and acquired 1,323 new customers ($90,000 / $68 average first order), nCAC is about $45. First-order contribution is $36, so each new customer loses about $9 on the first order and needs roughly $9 of repeat contribution to break even. At the 90-day repeat contribution of $9 from the table, payback lands at about 90 days. That is a business you can scale carefully, not one you can scale blindly.
A weekly scorecard that works
| Number | Why it is on the page |
|---|---|
| Net revenue (no tax, gift cards when redeemed) | The top line you actually keep |
| New customers and nCAC | Whether acquisition is getting harder |
| aMER vs break-even aMER | Whether acquisition pays on the first order |
| Returning customer revenue | How much of the month the base is carrying |
| MER | Overall marketing efficiency |
| Contribution after marketing | What the month actually earned before fixed costs |
| Platform ROAS by channel | For media buyers, to compare campaigns inside each platform |
Illustrative cases
MER held at 4x for a year. Acquisition efficiency fell 40%.
- What the dashboard said
- MER stayed between 3.9x and 4.2x for twelve months. The monthly report called performance stable.
- What was actually happening
- aMER fell from 2.3x to 1.4x over the same year, against a break-even aMER of 1.9x. The brand was losing money on every new customer's first order and had not noticed, because loyal subscribers kept total revenue rising.The cause was concentration: 80% of prospecting spend went to one hero product whose audience had saturated. New customers acquired through a second product had a higher first-order value and better 90-day repeat.
- Decision
- Fix Set a weekly aMER floor of 1.6x with a 120-day payback target, rebuild prospecting around the second product, and report new customer count at the top of every weekly update.
MER answers whether marketing is efficient overall. Only aMER answers whether the business is still growing its customer base at a price it can afford.
Cutting spend to hit an MER target shrank the business six months later
- What the dashboard said
- A new MER target of 5x was set to protect margin. Spend was cut 35%. MER rose to 5.3x within a month and the P&L looked better.
- What was actually happening
- New customer count fell 38%. Returning revenue held up for four months, then started to fall as the smaller new cohorts reached their repeat window. By month six total revenue was down 22%.
- Decision
- Test Restore spend in steps of 15% and hold each step for three weeks, keeping aMER above the 90-day payback target of 1.5x.
MER targets reward cutting acquisition. Always pair an MER target with a floor on new customers or aMER.
Why aMER matters more in 2026
Three recent changes make platform ROAS a weaker guide to budget and blended numbers like MER and aMER more important.
- Meta changed what a click-through conversion is. Since March 2026, click-through attribution counts only conversions after a link click, and conversions after likes, comments or engaged views sit in a separate engage-through window. Many accounts saw reported ROAS fall with no change in sales. Year-on-year platform ROAS is no longer like for like. MER and aMER, built from Shopify, did not change at all.
- Your existing customers are in the prospecting auction. With Meta's existing-customer budget cap removed from Advantage+ campaigns, broad prospecting can spend a large share on people who already buy from you. That inflates ROAS and MER at the same time. Only aMER separates them.
- More discovery happens where no click is tracked. Podcasts, creators and AI assistants send buyers who show up as direct or branded search. Platform ROAS misses them entirely. A ratio built on total revenue and total spend catches them, which is exactly why it should set the budget.
What to do this week
- Recalculate last month's MER using net revenue without sales tax and with gift cards counted on redemption.
- Split revenue into new and returning customers and calculate aMER for each of the last six months.
- Work out first-order contribution margin and your break-even aMER.
- Decide your payback window based on cash, not preference, and set your target aMER.
- Put new customer count, nCAC and aMER at the top of your weekly report, above ROAS.
Questions founders ask
What is a good MER for a DTC brand?
There is no universal number, because it depends on gross margin and how much revenue comes from returning customers. A brand with 75% gross margin and strong repeat can run a much lower MER than a brand with 40% margin. Work out the MER at which contribution after marketing covers your fixed costs, and use that as your floor.
What is the difference between MER and blended ROAS?
They are often used to mean the same thing: total revenue divided by total ad spend. The difference is usually in the inputs. MER, done properly, uses net revenue and all marketing spend including affiliates and influencers. Blended ROAS is often calculated from gross sales and media spend only.
What is aMER and who created it?
aMER is acquisition MER: revenue from new customers divided by total marketing spend. The term was popularised by the ecommerce agency Common Thread Collective as a way to focus budgeting on customer acquisition rather than total revenue.
Should I include returning customer revenue in ROAS targets?
Not for scaling decisions. Returning customers would mostly buy anyway. Including them makes prospecting look better than it is. Use aMER or new customer CAC for acquisition decisions and MER for overall efficiency.
How do I calculate break-even ROAS?
Divide 1 by your contribution margin after product cost, fulfilment, shipping, payment fees and expected returns. A 50% contribution margin gives a break-even of 2.0x. For acquisition decisions, calculate it on first orders, which usually carry a discount and have a lower margin.