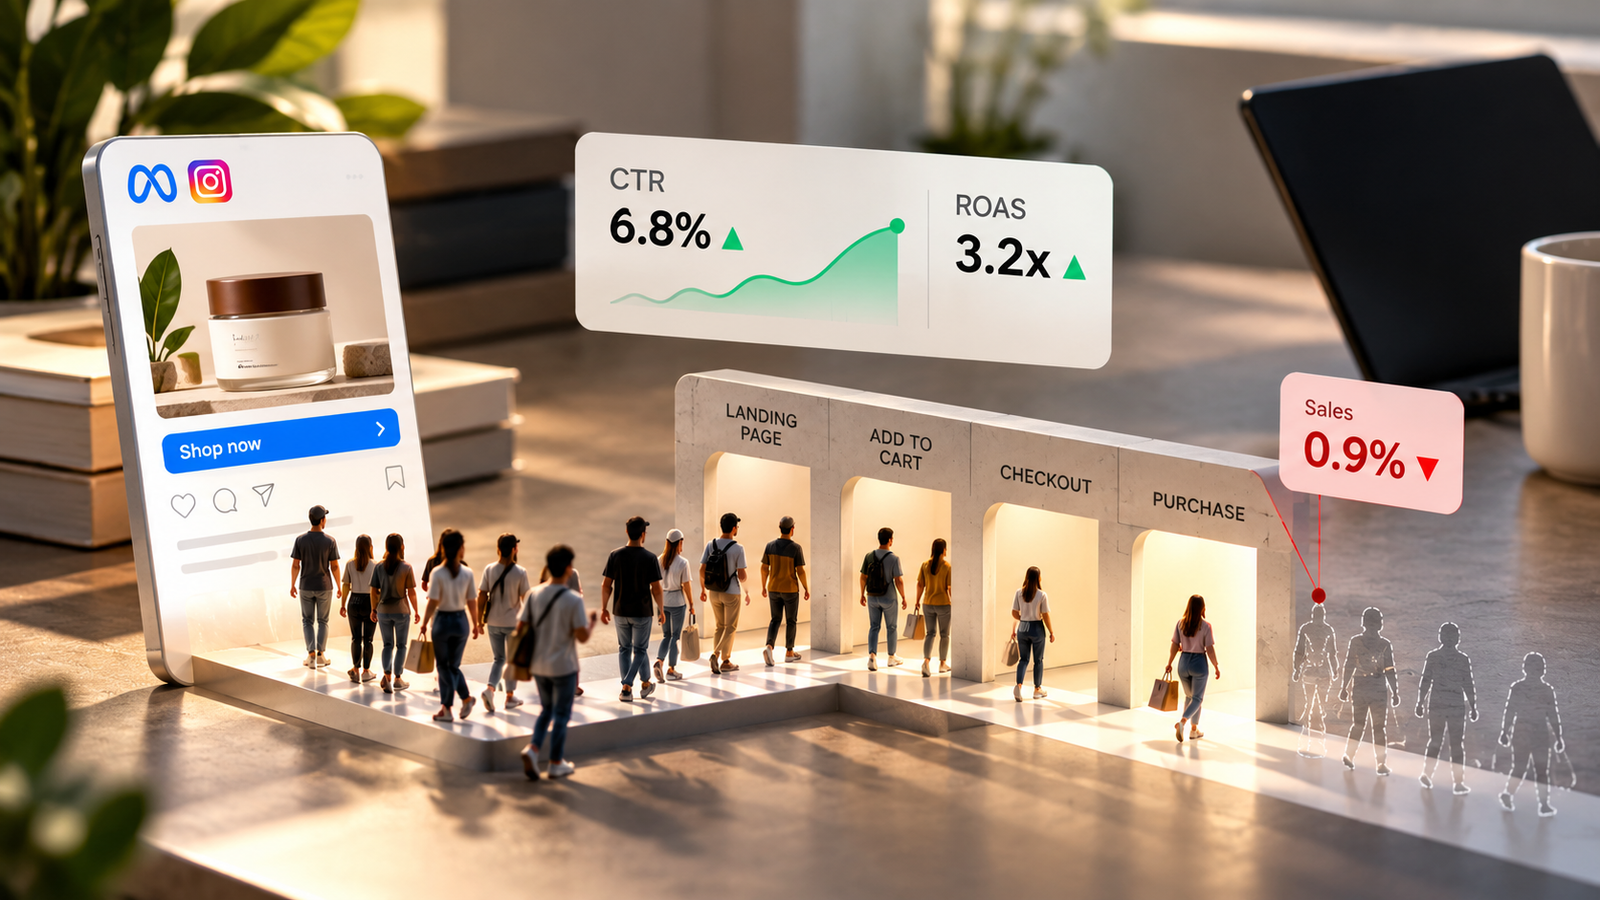
- CTR measures the ad. Sales measure the buyer. A hook that wins attention does not qualify buyers, and the people it attracts are often not the people who buy.
- Across more than 40,000 brands tracked by Triple Whale between August 2025 and July 2026, median Meta CTR rose about 16% while conversion rate fell about 5% and CPM rose about 13%. Clicks got easier to win and harder to turn into orders.
- A high-CTR ad also has the cheapest clicks, so it looks efficient in every weekly report. The cost shows up two steps later: small orders, the cheapest product, and buyers who do not come back.
- Before blaming the landing page, check two things: whether clicks became visits (landing page views vs link clicks), and whether the ad landed on the product it showed.
- Rank creatives by profit per click, not CTR. The two rankings rarely match.
In this article
Every creative review has a favourite. It is usually the ad with the best hook: a UGC video that opens with "wait till you see this", a 4% CTR, and the cheapest clicks in the account. The team moves budget towards it, the weekly report shows CPC falling, and everyone feels good about the creative strategy.
A month later, revenue has not moved. When we match that ad to Shopify orders, it turns out to be the only ad in the test losing money. It attracted curious people, landed them on the cheapest product, and produced buyers who rarely came back. The least clickable ad, a plain founder video with the price on screen, was making the most money per click.
Hooks win attention. They do not qualify buyers. This article explains why CTR and sales so often point in different directions, what the 2026 data says about it, and the one metric that ranks ads correctly.
Clicks got easier. Sales got harder.
This is not just one account. Triple Whale's benchmarks across more than 40,000 brands show the gap opening up across the whole market between August 2025 and July 2026.
Every one of the 17 industries tracked saw CTR rise; 11 saw conversion fall. Health and wellness was the extreme case: CTR up about 23%, conversion rate down about 14%. Creative has become better at earning clicks, partly because Meta's delivery now leans so heavily on the creative itself. It has not become better at earning orders.
Why the clickiest ad is often the least profitable
A high-CTR ad has the cheapest CPC, so it looks efficient in every report built on clicks. But a click is only a promise. What it is worth depends on three things the CTR column cannot see.
- Who clicked. A curiosity hook pulls in scrollers. An ad with the price on screen gets fewer clicks, from people who have already accepted the price.
- Where they landed. An ad that shows the full collection but lands on a page led by the cheapest set produces small orders.
- Whether they were new. People who already know your brand click more. Littledata says its audits of Shopify stores found most prospecting campaigns reaching existing buyers. That is retargeting at prospecting prices.
The case: the fragrance brand that scaled its worst ad
A home fragrance brand tested three prospecting ads at $5,000 each, same audience, $15 CPM. Contribution margin is 55%, so break-even ROAS is 1.82x. Ad A, a UGC video with a strong hook, had the best CTR by far, and the team started moving budget to it. Here is what the order data showed. The figures are an illustrative composite.
| Ad A: UGC hook | Ad B: Product demo | Ad C: Founder and offer | |
|---|---|---|---|
| CTR | 4.2% | 1.9% | 1.2% |
| CPC | $0.36 | $0.79 | $1.25 |
| Conversion rate | 0.6% | 2.4% | 3.5% |
| Orders and AOV | 84 at $52 | 152 at $64 | 140 at $78 |
| Revenue and ROAS | $4,368 (0.87x) | $9,728 (1.95x) | $10,920 (2.18x) |
| Profit after ad spend | -$2,598 | +$350 | +$1,006 |
| 90-day repeat | 8% | 21% | 29% |
Profit per click after ad spend, by ad (illustrative)
Profit per click = revenue per click x 55% contribution margin - CPC.
| Label | Profit per click |
|---|---|
| Ad A: UGC hook (4.2% CTR) | -$0.19 |
| Ad B: Product demo (1.9% CTR) | $0.06 |
| Ad C: Founder and offer (1.2% CTR) | $0.25 |
Ad A's hook showed the full collection but landed on a page led by the cheapest set, with no price in the ad. Curious clicks, small orders, few returning customers. It was the only ad losing money, and the one getting more budget. The ranking by CTR (A, B, C) was the exact reverse of the ranking by profit (C, B, A).
What changed: Ad C got the budget. Ad A's hook was kept, because it was genuinely good at stopping the scroll, but re-cut with Ad C's offer and price on screen, and sent to the product it actually showed. Creative reviews now show profit per click next to CTR.
Where clicks leak before they become orders
The Shopify Community is full of versions of the same story. A founder with a 6% CTR and 8-cent clicks had 167 link clicks and no sales on a campaign optimised for purchases. Another had hundreds of clicks a day and zero sales for three weeks, with many visits lasting under a second. One ad with a 7.44% CTR and about 4,000 clicks showed almost no visits in Shopify. The replies mostly say: add trust badges, sharpen the call to action. Almost nobody asks the first question: did the click become a visit, and where did it land?
| Step | Metric | Healthy sign | If it leaks here, check |
|---|---|---|---|
| Click to visit | Landing page views / link clicks | Above about 70% | Page speed, accidental taps from placements, broken links, bot traffic |
| Visit to engaged visit | Sessions longer than 10 seconds | Most sessions | Mismatch between ad promise and page, pop-ups covering the page |
| Engaged visit to add to cart | Add-to-cart rate on the landing product | Close to your store average | Wrong product, hidden price, missing reviews or sizing |
| Cart to order | Checkout completion rate | Close to your store average | Shipping cost surprise, payment options, slow checkout |
| Order to customer | New-customer share and 90-day repeat | Mostly new buyers who come back | Prospecting reaching existing customers; ads attracting one-time buyers |
How to rank your ads correctly
- Pull 30 to 60 days of ad-level data. Only judge ads with at least 1,000 clicks or 20 purchases.
- Compare landing page views with link clicks for each ad.
- Match each ad to Shopify orders using UTMs and use Shopify revenue, not platform-reported purchase value.
- Calculate revenue per click and profit per click using each product's contribution margin.
- Split each ad's buyers into new and returning.
- Put the profit-per-click ranking next to the CTR ranking. The difference between them is your creative strategy's blind spot.
The decision
| Decision | What to do |
|---|---|
| Scale | The ad with the highest profit per click and the best repeat rate. Watch profit per click as you scale, not CTR. |
| Fix | High-CTR ads that land on the wrong product or hide the price. Send them to what they show. |
| Test | Your best hook with your best offer, for two to three weeks. |
| Stop | Ranking creatives by CTR alone, and running traffic campaigns to buy cheap clicks. |
The fragrance brand that scaled its worst ad
- What the dashboard said
- Ad A had a 4.2% CTR and the cheapest clicks in the account. Budget was moving towards it.
- What was actually happening
- Ad A converted at 0.6%, on small orders of the cheapest set, at a 0.87x ROAS against a 1.82x break-even. It lost $0.19 on every click. The least clickable ad made $0.25 per click.
- Decision
- Fix Move budget to Ad C, re-cut Ad A's hook with Ad C's offer and visible price, and land it on the product it shows.
CTR is a creative metric, not a sales metric.
Profit per click needs a margin behind it. If you have not set one per product yet, start with our guide to break-even ROAS by product. And if you want every live creative ranked by what it actually earns, matched to your Shopify orders, that is part of a Blindspot Snapshot.
Questions founders ask
What is a good CTR for Meta ads in ecommerce?
Triple Whale's median across more than 40,000 brands from August 2025 to July 2026 was 2.39%. Use it as a reference point, not a goal. A lower CTR from people who already accept your price is often more profitable than a high CTR from curious scrollers.
Why do my Facebook ads get clicks but no sales?
The usual causes, in order of how often we see them: the ad attracts curiosity rather than buying intent, the click lands on a different or cheaper product than the ad showed, the price is hidden until the page, many clicks never become page views because of accidental taps or slow loading, or a large share of clicks come from existing customers who were not about to buy again.
Is high CTR with low sales always a landing page problem?
No. Check who clicked, which product they landed on, and the placement first. Landing page changes help only when the right people are arriving on the right page and still not buying.
Why does Meta show more clicks than Shopify shows sessions?
Link clicks include accidental taps, bots and people who leave before the page loads. Landing page views are closer to real visits. A gap of more than about 30% between link clicks and landing page views is worth investigating.
Should I run traffic campaigns to get cheaper clicks?
Not if you want sales. Traffic campaigns find people likely to click, not people likely to buy. Optimise for purchases and judge creatives on revenue and profit per click.
Sources
- Triple Whale: Facebook and Meta ads benchmarks, August 2025 to July 2026
- Littledata: New vs returning customers in Meta, the hidden leak in your scaling strategy
- Shopify Community: High metrics but no sales on Facebook ads
- Shopify Community: High traffic and CTR but zero sales
- Shopify Community: Facebook clicks vs Shopify page views