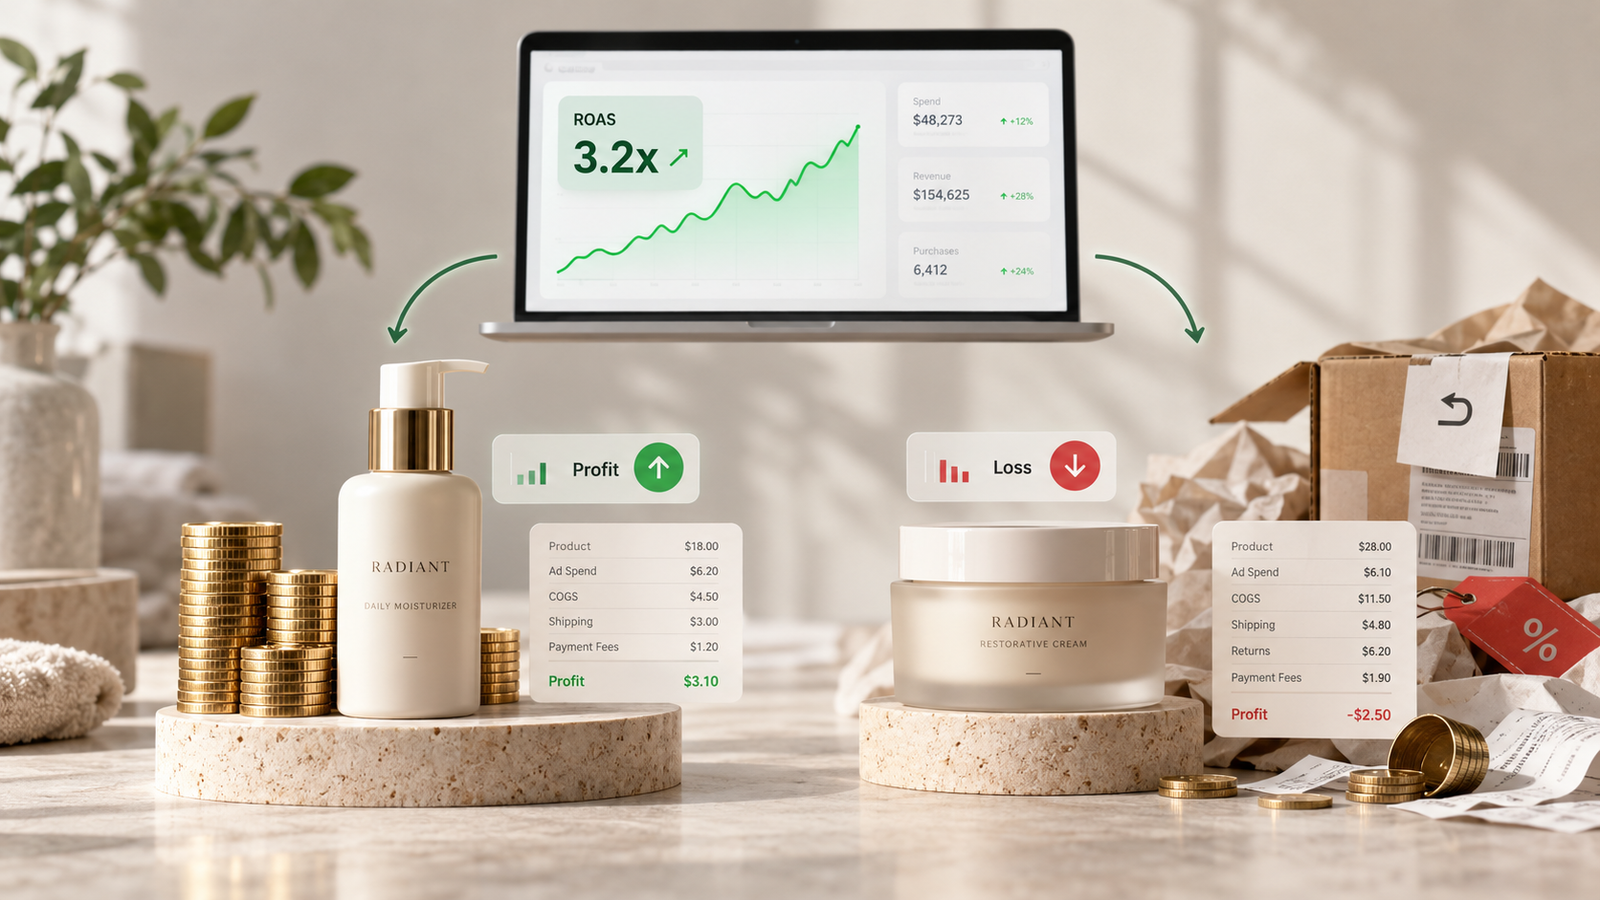
- ROAS measures revenue per ad dollar. Profit depends on margin, and every product has a different one. A single account-wide ROAS target hides the products that lose money on every order.
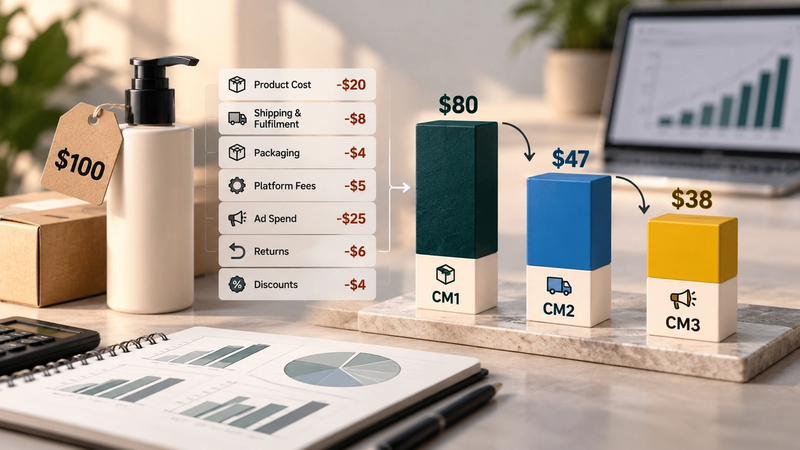
- Break-even ROAS for a product is 1 divided by its contribution margin after product cost, shipping, fees, discounts and returns. A product with a 22% margin needs 4.55x just to break even.
- A sale can push ROAS up and still turn a profitable campaign into a losing one, because the discount lowers the margin faster than it raises conversion.
- The product shown in the ad is often not the product in the cart. Judge each product on Shopify revenue from paid orders, not on what the platform says the ad sold.
- Scale the products furthest above their floor, fix the ones sitting on it, and move the ones below it out of prospecting and into add-ons.
In this article
The weekly report has been green for five months. Meta ROAS is steady at 3.0x. CPA is stable, CTR is fine, and the founder of a skincare brand is planning to double spend for the fourth quarter. There is only one problem, and it is the one that keeps her up at night: at the end of every month, there is less cash than the dashboard suggests there should be.
When ROAS looks fine and cash is tight, the first thing we do is close Ads Manager and open the order export. The ad account tells you what the platform wants credit for. The order export tells you what customers actually bought, at what price, at what discount, and how much came back as refunds. The two stories almost always split at the product level, and that is where the money goes missing.
ROAS is a revenue number. Your bank balance is a margin number.
ROAS (return on ad spend) divides revenue by ad spend. It says nothing about what that revenue cost you to produce and deliver. Two products can have identical ROAS and completely different profitability, because one keeps 62 cents of every dollar after costs and the other keeps 22.
That is why every product has its own floor: the ROAS at which a sale exactly pays for the ads that bought it, and nothing more. Above the floor, ads make money. Below it, every order loses money, no matter how good the ROAS looks next to the account average.
| Contribution margin | Break-even ROAS | Is a 3x ROAS profitable? |
|---|---|---|
| 70% | 1.43x | Yes, comfortably |
| 60% | 1.67x | Yes |
| 50% | 2.00x | Yes |
| 40% | 2.50x | Yes, but thin |
| 33% | 3.03x | Roughly break-even |
| 25% | 4.00x | No |
| 20% | 5.00x | No, loses about 40 cents per ad dollar |
Contribution margin after product cost, shipping, fulfilment, payment fees, discounts and returns.
The case: a 3x account hiding two products below their floor
Back to the skincare brand, spending about $30,000 a month on Meta. About 45% of spend went to catalog and gift-season ads. When we split one month of spend and revenue by what customers actually bought, the 3.0x account looked like this. The figures are an illustrative composite.
ROAS from Shopify orders vs each product's break-even ROAS (illustrative skincare brand)
Contribution margins: serum 62%, moisturiser 48%, gift set 34%, travel kit 22%. Account ROAS 3.01x.
| Label | Actual ROAS | Break-even ROAS |
|---|---|---|
| Serum | 3.4x | 1.61x |
| Moisturiser | 3.1x | 2.08x |
| Gift set | 2.9x | 2.94x |
| Travel kit | 2.4x | 4.55x |
| Product | Ad spend | Revenue | ROAS | Break-even | Contribution after ad spend |
|---|---|---|---|---|---|
| Serum | $9,260 | $31,500 | 3.40x | 1.61x | +$10,270 |
| Moisturiser | $7,260 | $22,500 | 3.10x | 2.08x | +$3,540 |
| Gift set | $7,760 | $22,500 | 2.90x | 2.94x | -$110 |
| Travel kit | $5,620 | $13,500 | 2.40x | 4.55x | -$2,650 |
| Total | $29,900 | $90,000 | 3.01x | +$11,050 |
Contribution after ad spend = revenue x contribution margin - ad spend.
Contribution after ad spend by product, one month (illustrative)
The travel kit lost about 47 cents on every ad dollar. Doubling spend would have doubled the loss.
| Label | Contribution after ad spend |
|---|---|
| Serum | $10.3K |
| Moisturiser | $3,540 |
| Gift set | -$110 |
| Travel kit | -$2,650 |
The travel kit was the most common first-order item, simply because it was the cheapest thing in the catalog. Catalog ads served it to price-sensitive clicks, and the free-shipping bar nudged it into carts. The ad showed the serum. The cart held the $24 travel kit. Ads Manager reported one ROAS for both. The margin did not.
What changed: the travel kit came out of prospecting and moved to a post-purchase add-on, where it lifts order value without being asked to carry acquisition. The gift set's price went up $5, which moved it above its floor. The serum got the extra budget, added in steps. On paper, moving the travel kit's $5,620 to the serum at its current ROAS is worth about $8,900 a month in contribution, if the serum holds its ROAS at higher spend. That last condition is the thing to watch, and it is why scaling happens in steps.
What a sale does to the math
This is the detail most teams miss. A discount pushes conversion rate up, so ROAS rises and the weekly report looks great. But the discount comes straight out of margin, so the floor rises faster than ROAS does. Take a $50 product that costs $30 to make, ship and process.
| Full price | 20% off | |
|---|---|---|
| Price | $50 | $40 |
| Contribution per order | $20 | $10 |
| Contribution margin | 40% | 25% |
| Break-even ROAS | 2.50x | 4.00x |
| ROAS on the dashboard | 3.0x | 3.6x |
| Profit per ad dollar | +$0.20 | -$0.10 |
ROAS went up 20%. The campaign went from making money to losing it. And the cost does not end there: discount-heavy periods can train customers to wait for the next sale, which we cover in our guide to discount dependency.
How to calculate break-even ROAS for every product
- Export 90 days of Shopify orders with line items, discounts and refunds.
- Build a cost sheet by SKU: landed product cost (including duties and freight), pick and pack, packaging, average shipping cost, payment fees, and expected returns cost.
- Calculate contribution margin and break-even ROAS for each SKU at its actual average selling price, after discounts.
- Assign ad spend to products. Product-specific ad sets go directly to their product. Catalog and mixed ads are split by each product's share of first orders from paid social.
- Compare each product's Shopify-based ROAS with its own floor, not with the account target.
- Repeat the math for your last sale period at the discounted price. This is where most surprises are.
Do not forget returns and landed cost
Two inputs move break-even ROAS more than most founders expect. Returns: a product with a 70% gross margin and a 30% return rate can need a higher ROAS than a 50% margin product that nobody sends back (see our guide to returns by SKU). And landed cost: tariff changes in 2025 and 2026 shifted product costs for many brands, sometimes by several points of margin. If your cost sheet predates your last reorder, rebuild it with our guide to tariffs and landed cost in 2026.
The decision: scale, fix, test or stop by product
| Where the product sits | Decision | What to do |
|---|---|---|
| Well above its floor | Scale | Raise spend in steps of 20% to 30%. Stop when ROAS falls towards the floor. |
| On the floor | Fix | A small price, bundle or shipping change usually moves the floor more than better ads would. |
| Below the floor, but buyers repeat well | Test | Keep it in prospecting only if 90-day contribution clears the CAC. Measure it. |
| Below the floor, buyers do not repeat | Stop | Remove it from prospecting. Use it as a post-purchase or cart add-on for four weeks and compare. |
Before stopping a below-floor product, check what its buyers do next. Some low-margin products are excellent first purchases that lead to profitable second orders. Our guide to finding your gateway product shows how to tell the difference.
Key learnings
- ROAS is a revenue ratio. Only judge it against a margin.
- Every product has its own floor. One account target hides the ones below it.
- The product in the ad is often not the product in the cart.
- A sale can raise ROAS and still turn a profitable campaign into a losing one.
Break-even by product tells you which products deserve budget. Whether the next dollar will pay back is a separate question, covered in why blended ROAS is not a scaling signal. If you want both answered on your own numbers, with every product's floor calculated from your real costs, that is what a Blindspot Snapshot delivers.
Questions founders ask
How do I calculate break-even ROAS?
Divide 1 by your contribution margin. Contribution margin is (price minus product cost, shipping, payment fees, discounts and expected returns) divided by price. A product with a 40% contribution margin has a break-even ROAS of 1 / 0.40 = 2.5x.
Is a 3x ROAS good?
Only if your contribution margin is above 33.3%. Below that, a 3x ROAS loses money on the first order. Whether it is good overall also depends on how much your customers spend after the first order.
What is the difference between break-even ROAS and target ROAS?
Break-even ROAS covers your costs with nothing left over. Target ROAS adds the profit you want to keep. The formula is 1 / (contribution margin - target profit margin). At a 40% contribution margin, keeping 10% of revenue as profit needs 1 / (0.40 - 0.10) = 3.33x.
Should I use platform ROAS or Shopify revenue?
Use Shopify orders for product-level ROAS. Platforms can credit the same order more than once, and they report what the ad promoted rather than what the customer actually bought. Platform ROAS is still useful for optimising within a campaign.
How often should I recalculate break-even ROAS?
Monthly, and before every sale, price change or reorder with a new landed cost. In 2025 and 2026, tariff and carrier rate changes moved product costs enough to shift break-even ROAS by a meaningful amount for many brands.