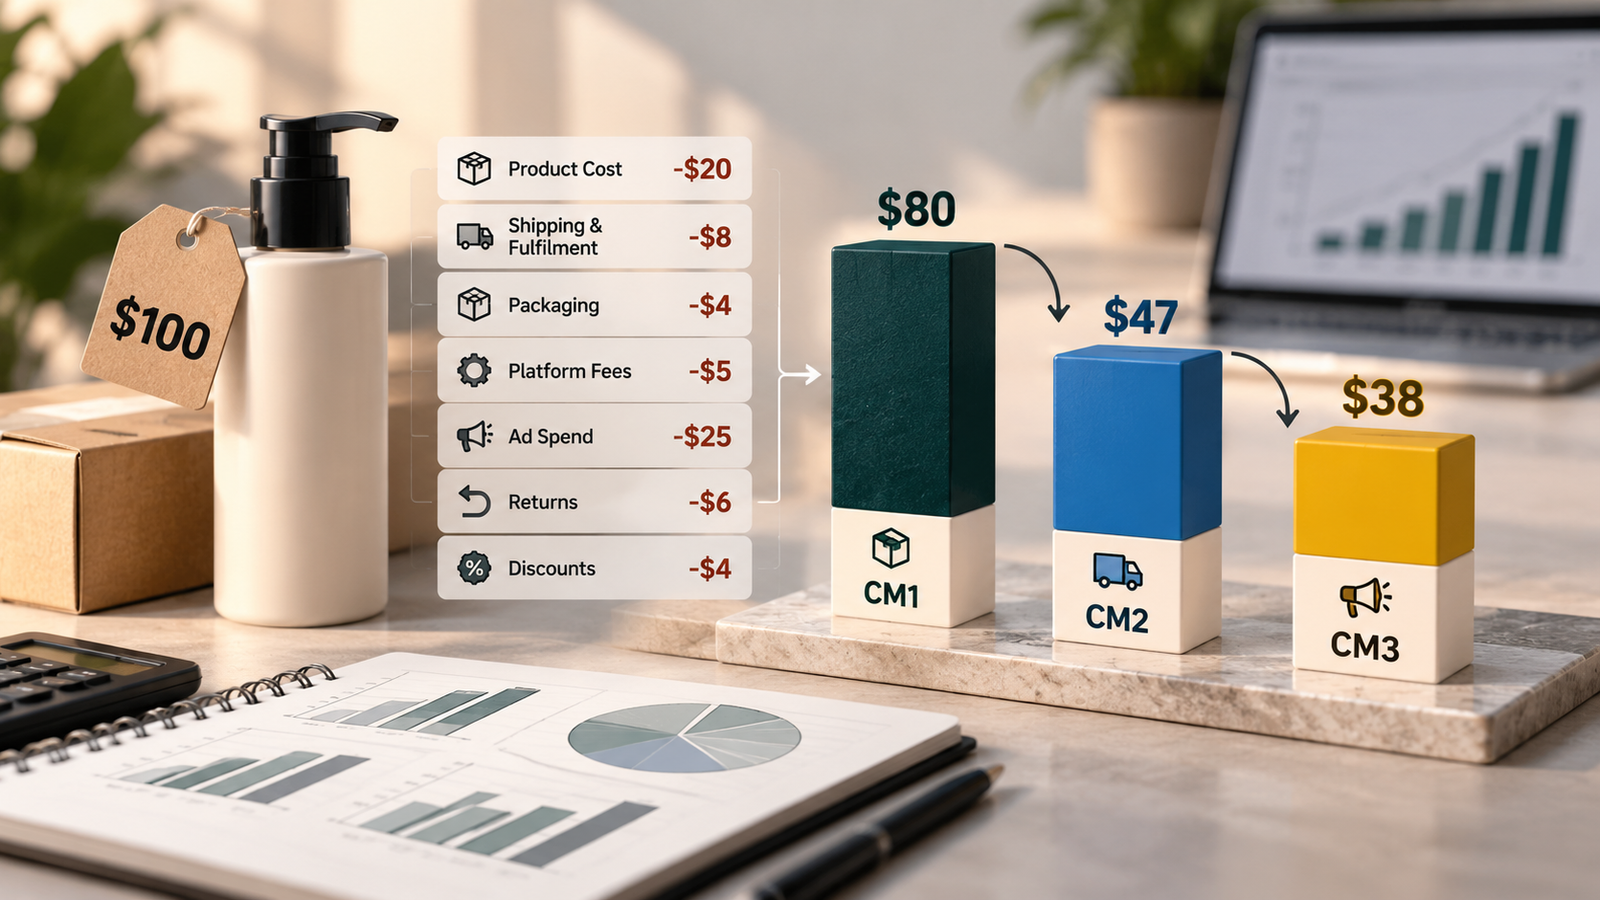
- Gross margin only takes off product cost. For a DTC brand, shipping, fulfilment, payment fees, discounts and returns often take another 20 to 30 points of revenue before a single ad is bought.
- CM1 is net revenue minus product cost. CM2 subtracts the variable cost of getting each order to the customer and keeping it there. CM3 subtracts marketing.
- CM2 is the number that should set your ad budget: break-even ROAS is 1 divided by CM2 as a share of revenue.
- CM3 tells you whether the month actually made money before fixed costs. A brand can grow revenue every month while CM3 shrinks.
- Calculate all three by month, by channel and by your top products. The averages hide the product or channel that is losing money.
In this article
A founder tells us her gross margin is 70%. It is a skincare brand, products cost very little to make, and the number is accurate. On that basis, she set a ROAS target of 2.0x, believing it left plenty of room for profit. Revenue grew every quarter. The bank balance did not.
When we built her P&L line by line, the 70% gross margin turned into a 44% contribution margin before marketing. Shipping, packaging, fulfilment, payment fees, the welcome discount and returns took 26 points of every dollar between the product leaving the warehouse and the money arriving in the bank. Her real break-even ROAS was 2.27x, not 1.43x. Every month she ran at 2.0x, she was paying customers to buy.
Gross margin is the number most founders know. Contribution margin is the number that runs the business. This article explains the three levels, CM1, CM2 and CM3, how to calculate each one, and which one should set your ad budget.
The three levels in plain English
| Level | Formula | Answers the question | Use it for |
|---|---|---|---|
| CM1 | Net revenue minus landed product cost | Is the product priced well against what it costs to make and import? | Pricing, sourcing, supplier negotiations |
| CM2 | CM1 minus fulfilment, shipping, packaging, payment fees and returns costs | What does each order leave us before we pay to acquire it? | Break-even ROAS, CAC targets, channel comparisons |
| CM3 | CM2 minus marketing spend | Did this month's sales actually pay for themselves? | Monthly performance, budget decisions, cash planning |
A worked P&L, line by line
Here is one month for the skincare brand from the opening, simplified. It is an illustrative composite, but every line is a real cost that DTC brands carry.
| Line | Amount | % of net revenue |
|---|---|---|
| Gross sales | $100,000 | |
| Discounts | -$9,000 | |
| Refunds | -$5,000 | |
| Net revenue | $86,000 | 100% |
| Landed product cost (incl. freight and duty) | -$22,400 | 26% |
| CM1 | $63,600 | 74% |
| Shipping labels | -$9,500 | 11% |
| Pick, pack and packaging | -$4,300 | 5% |
| Payment processing | -$2,600 | 3% |
| Returns handling and unsellable stock | -$1,300 | 1.5% |
| Apps charged per order | -$600 | 0.7% |
| CM2 | $45,300 | 52.7% |
| Paid media | -$34,000 | 39.5% |
| Affiliate and creator fees | -$3,500 | 4.1% |
| CM3 | $7,800 | 9.1% |
Fixed costs such as salaries, software subscriptions and rent come out after CM3.
Where $86,000 of net revenue went in one month ($K, illustrative)
| Label | Amount |
|---|---|
| Landed product cost | $22.4K |
| Shipping, fulfilment and packaging | $13.8K |
| Payment, returns and per-order apps | $4.5K |
| Marketing | $37.5K |
| CM3 left over | $7.8K |
Notice the gap between how the founder thought about the business and how it actually ran. The product margin really was excellent. But 21 points of revenue disappeared between CM1 and CM2, and marketing took most of what was left. The brand made $7,800 before paying anyone's salary on $100,000 of sales.
Why CM2 should set your ad budget
CM2 is what each order leaves you to spend on acquiring it. That makes it the basis for every acquisition target.
Break-even ROAS implied by each margin for the same brand
The founder was running at 2.0x, below the only break-even that mattered for acquisition.
| Label | Break-even ROAS |
|---|---|
| Gross margin (70%) | 1.43x |
| Blended CM2 (52.7%) | 1.9x |
| First-order CM2 (44%) | 2.27x |
Two refinements make this much more useful. First, calculate CM2 by product, because margins differ a lot across a catalog; we show how in break-even ROAS by product. Second, use first-order CM2 for acquisition targets, and compare it with aMER rather than platform ROAS, as covered in MER vs ROAS vs aMER.
Why CM3 is the monthly scoreboard
CM3 answers the question a founder actually cares about: after paying for the product, the delivery and the marketing, how much did this month's sales leave to cover the team and the rent? It is the number that shows whether growth is paying for itself.
Monthly net revenue and CM3, $K (illustrative)
Marketing spend grew faster than the CM2 it bought. A revenue dashboard showed steady growth throughout.
| Label | Net revenue | CM3 |
|---|---|---|
| Jan | $86K | $11.7K |
| Feb | $91K | $11.2K |
| Mar | $97K | $10.4K |
| Apr | $103K | $9.3K |
| May | $108K | $8.6K |
| Jun | $114K | $7.8K |
The costs founders most often leave out
| Cost | Belongs in | Why it gets missed |
|---|---|---|
| Inbound freight and duties | CM1 (landed cost) | Paid to a freight forwarder or broker, not the supplier |
| Packaging, inserts and gift wrap | CM2 | Bought in bulk and treated as overhead |
| Shipping on free-shipping orders | CM2 | Never appears as a line on the order |
| Return labels and unsellable returns | CM2 | Arrives weeks after the sale, in a different report |
| Apps that charge per order (reviews, subscriptions, upsells) | CM2 | Billed monthly with software, so looks fixed |
| Creator, affiliate and influencer fees | CM3 | Paid outside the ad platforms |
| Free samples and gifts with purchase | CM2 | Sit in inventory, not marketing |
Cut it three ways: month, channel and product
A single company-wide contribution margin hides the place where money is leaking. Run the same calculation three ways.
- By month, to see whether growth is getting more or less profitable.
- By channel, because a DTC order, an Amazon order and a TikTok Shop order carry very different fees. See Amazon vs DTC.
- By product, because return rates, weight and discount use vary by SKU. See returns by SKU.
A 70% gross margin, a 2.27x break-even
- What the dashboard said
- A 70% gross margin, and a ROAS target of 2.0x that looked generous.
- What was actually happening
- Shipping, fulfilment, fees, discounts and returns took the margin from 74% at CM1 to 44% at CM2 on first orders. First-order break-even ROAS was 2.27x. The account had been running below it for most of the year.
- Decision
- Fix Reset acquisition targets to first-order CM2, raise the free-shipping threshold above the most common basket, replace the 15% welcome code with a gift, and report CM3 monthly next to revenue.
Gross margin tells you about the product. Contribution margin tells you about the business.
Do this in one afternoon
- Pull last month's net revenue from Shopify, excluding tax.
- Add landed product cost from your inventory or accounting system, including freight and duty.
- Add the month's carrier and 3PL invoices, payment processor fees, returns costs and per-order app fees.
- Add all marketing spend, including creators and affiliates.
- Calculate CM1, CM2 and CM3, then your break-even ROAS from CM2. Compare it with the ROAS target your team is using.
Most founders who do this find their real break-even is higher than they assumed. Building this P&L by channel and by product, and setting targets from it, is the first thing we do in a Blindspot Snapshot.
Questions founders ask
What is contribution margin in ecommerce?
Contribution margin is what is left from revenue after all the costs that rise and fall with each order: product cost, shipping, fulfilment, payment fees, discounts, returns and, depending on the level, marketing. It shows how much each order contributes towards fixed costs and profit.
What is the difference between CM1, CM2 and CM3?
CM1 is net revenue minus landed product cost. CM2 is CM1 minus fulfilment, shipping, payment fees and returns costs. CM3 is CM2 minus marketing spend. Some teams also put discounts and returns into net revenue rather than CM2; consistency matters more than which convention you choose.
What is a good contribution margin for a DTC brand?
It varies widely by category. As a rough guide, many healthy consumable and beauty brands run CM2 in the 45% to 65% range, while apparel and heavier products often sit lower. The more useful question is whether CM3 is positive and growing, and whether each channel and product clears its own break-even.
How does contribution margin relate to break-even ROAS?
Break-even ROAS equals 1 divided by CM2 as a share of revenue. A 50% CM2 means you need 2.0x ROAS on a first order to break even on that order. Use first-order CM2 for acquisition, because first orders often carry bigger discounts and smaller baskets.
Should salaries and software be in contribution margin?
No. Contribution margin includes only costs that change with each order or each marketing dollar. Salaries, rent, software subscriptions and agency retainers are fixed costs that come out after CM3.