- US shoppers were expected to return 19.3% of online purchases in 2025, according to the NRF. Your average hides much higher rates on specific products, sizes and channels.
- A return costs the refund plus the outbound shipping you already paid, the return label, handling, the value lost on resale, fees you do not get back, and the ad spend that bought the order.
- Break-even ROAS must be calculated after returns. A product with a 70% gross margin and a 30% return rate can need a higher ROAS than a 50% margin product nobody sends back.
- Return rates differ by channel. Customers acquired through heavy discounts, some influencer codes and broad prospecting often return more than customers from email or search.
- On the tax side, returns reduce your taxable sales and damaged returns can usually be valued down, but only if your records connect each refund to the original sale.
In this article
Every apparel founder has a product like the linen jumpsuit. It is the best seller. It has the best gross margin in the store, it looks incredible in ads, and it gets the biggest share of the Meta budget. It is also, quietly, the product that loses money on every ad dollar behind it.
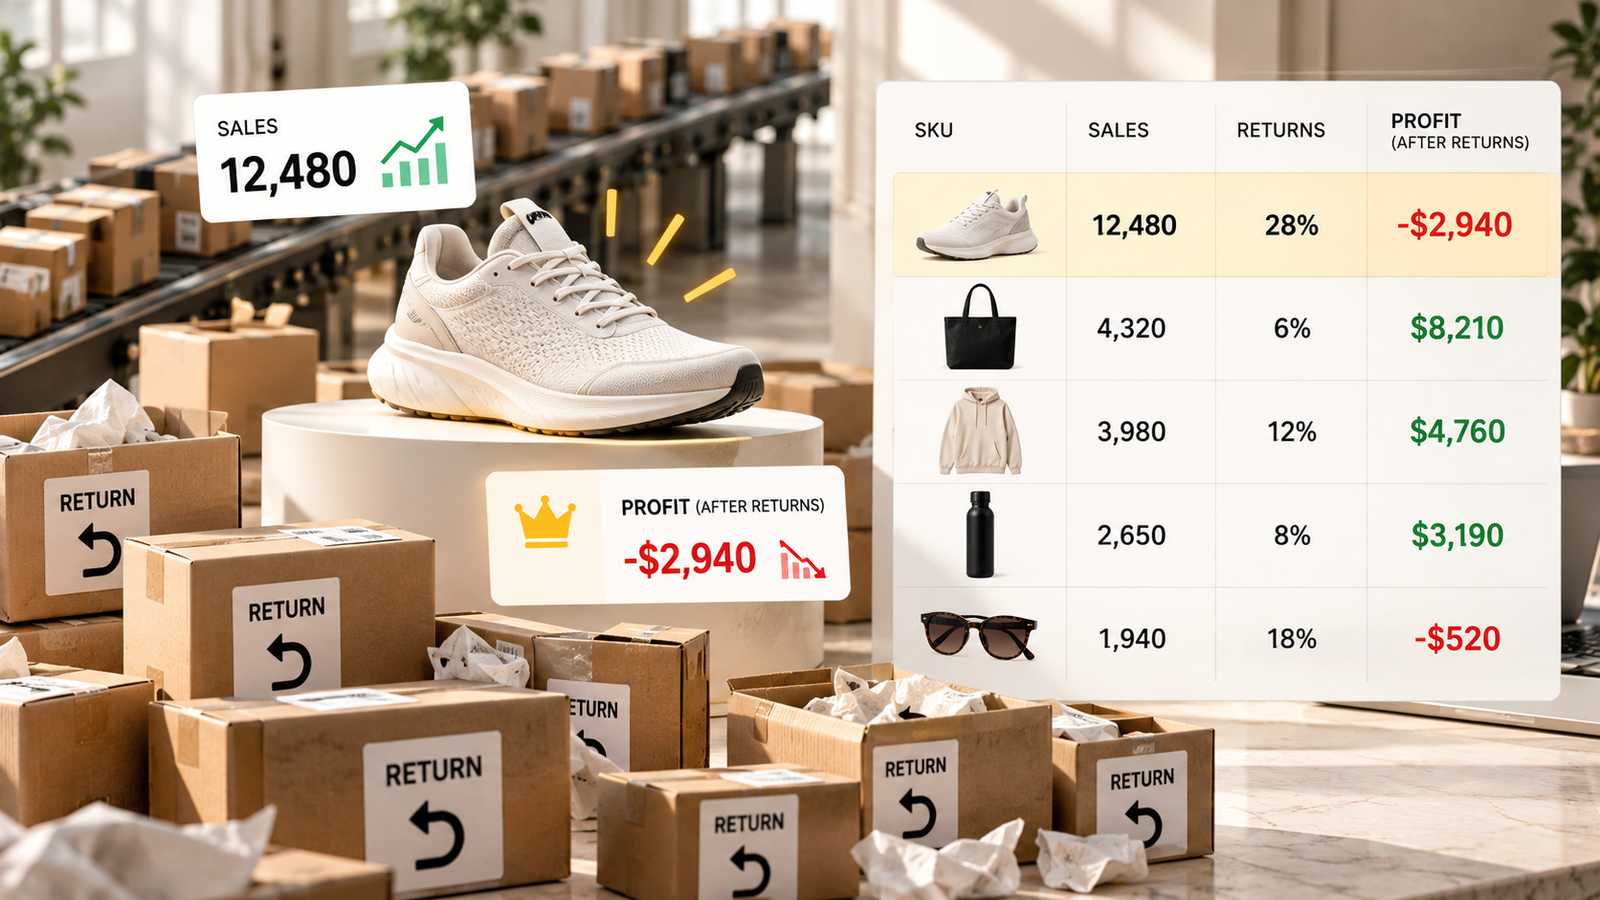
Nobody sees it because the cost arrives in a different report, weeks later. The sale shows up in Ads Manager on day one. The return shows up in Shopify three weeks after that, as a refund. The outbound shipping you already paid, the return label, the warehouse time, the item that comes back creased and cannot be sold as new, the payment fee you do not get back and the ad spend that bought the order never appear in the same place at all. Put them together and the 72% margin best seller needs a 3.4x ROAS just to break even.
Most Shopify dashboards rank products by gross sales. That ranking quietly assumes every sale stays sold. For many categories it is the wrong assumption, and the product at the top of the list is often the one with the worst economics once returns are counted.
This article shows how to cost a return properly, how to rebuild break-even ROAS for each SKU after returns, and how to spot the channel and product combinations that are costing you money.
How big the problem is
The National Retail Federation estimated total US retail returns at about $850 billion in 2025, 15.8% of sales, with online purchases returned at 19.3%. It also estimated that around 9% of returns were fraudulent, and that 82% of shoppers see free returns as a major factor when choosing where to buy.
Averages like these are useful for context and useless for decisions. Apparel sizes, shade-matched beauty, footwear and anything with a fit or feel component can run far above them. Consumables and gifts often run far below. The number that matters is yours, split by product and by where the customer came from.
What a return really costs
| Cost line | Typical treatment | Often missed? |
|---|---|---|
| Refund of product price | Shows up in Shopify as a return | No |
| Outbound shipping you paid | Already spent, not recovered | Yes |
| Return shipping label | Paid by you on free returns | Sometimes |
| Receiving, inspecting, restocking | Warehouse or 3PL fee per return | Yes |
| Value lost on resale | Items that cannot be sold as new are discounted, liquidated or destroyed | Yes |
| Payment processing fee | Many processors keep the original fee on refunds | Yes |
| Customer service time | Emails, exchanges, disputes | Yes |
| Ad spend that bought the order | The acquisition cost of a sale that did not stick | Almost always |
| Line | Amount |
|---|---|
| Refund to customer | $80.00 |
| Outbound shipping already paid | $7.50 |
| Return label | $8.00 |
| 3PL returns processing | $3.50 |
| Resale loss (25% of units cannot be sold as new, sold at half of cost) | $3.00 |
| Payment fee not refunded | $2.60 |
| Total cost beyond the refund | $24.60 |
Illustrative. The product cost comes back only when the item goes back into sellable stock. Ad spend for the order is covered in the SKU table below.
Cost lines from the worked example above
Total $24.60, before counting the ad spend that bought the order.
| Label | Cost |
|---|---|
| Return label | $8 |
| Outbound shipping already paid | $7.5 |
| 3PL returns processing | $3.5 |
| Resale loss | $3 |
| Payment fee not refunded | $2.6 |
Nearly $25 on an $80 order, before any ad spend. On a product with a 30% return rate, that is roughly $7.40 of extra cost spread across every order sold, or more than 9% of revenue.
Break-even ROAS after returns, by SKU
In MER vs ROAS vs aMER we show how break-even ROAS comes from contribution margin. Returns change that margin in two ways: some revenue disappears, and each return adds its own cost. When you calculate margin per SKU with both included, the ranking of your products often changes.
| SKU | Price | Gross margin | Return rate | Return-adjusted contribution | Break-even ROAS |
|---|---|---|---|---|---|
| Linen jumpsuit (best seller) | $120 | 72% | 34% | $35.10 | 3.42x |
| Wrap dress | $95 | 68% | 18% | $37.25 | 2.55x |
| Knit top | $68 | 66% | 9% | $29.05 | 2.34x |
| Canvas tote | $58 | 62% | 3% | $25.25 | 2.30x |
Illustrative numbers, rounded. Fulfilment $7 per order, payment fees 3%, $25 cost beyond refund per return, 75% of returned units restocked as new.
Return-adjusted break-even ROAS by SKU (same store)
Gross margin ranks the jumpsuit first. Return-adjusted break-even ranks it last.
| Label | Break-even ROAS after returns |
|---|---|
| Linen jumpsuit (72% GM, 34% returns) | 3.42x |
| Wrap dress (68% GM, 18% returns) | 2.55x |
| Knit top (66% GM, 9% returns) | 2.34x |
| Canvas tote (62% GM, 3% returns) | 2.3x |
The jumpsuit has the best gross margin in the store and the highest revenue. After returns, it needs a 3.4x ROAS to break even, against 2.3x to 2.6x for everything else. If the ad account runs one ROAS target of 2.5x across the catalogue, it is profitable on the knit top and the tote, roughly break-even on the dress, and losing money on the product that gets the most budget.
Return rate by channel and offer
The same product can have very different return rates depending on how the customer arrived. Common patterns:
- Deep discounts and sitewide sales bring in customers who buy more speculatively and return more.
- Broad prospecting on social reaches people with less intent and less product knowledge than search or email buyers.
- Some influencer codes bring in customers who bought the creator's look rather than the product, especially in apparel and beauty.
- Buy now, pay later can raise order size and bracketing (ordering two sizes to keep one) in apparel.
- Email and SMS buyers are usually existing customers who know their size and your product, and return least.
| Channel | Share of new customers | Return rate | Net revenue kept per $100 sold |
|---|---|---|---|
| Meta prospecting | 48% | 27% | $73 |
| Influencer codes | 14% | 31% | $69 |
| Google search | 20% | 16% | $84 |
| Email and SMS (first order) | 12% | 12% | $88 |
| Organic and direct | 6% | 14% | $86 |
Illustrative. Net revenue kept is before the extra cost of each return.
Return rate by the channel of the customer's first order (illustrative)
A channel's ROAS should be judged on revenue kept, not revenue sold.
| Label | Return rate |
|---|---|
| Influencer codes | 31% |
| Meta prospecting | 27% |
| Google search | 16% |
| Organic and direct | 14% |
| Email and SMS | 12% |
This changes how you read channel ROAS. A 2.6x Meta ROAS at a 27% return rate keeps about 1.9x of revenue. The same ROAS from search keeps about 2.2x. Platforms report the sale on the day it happens and never subtract the return.
Where returns come from, and what fixes them
Look at return reasons by SKU and by variant before changing prices or budgets. Different reasons need different fixes.
| Reason | Usually means | First fix to try |
|---|---|---|
| Too small or too large | Size chart, fit notes or sizing is off for this item | Fit notes on the product page, size advice based on returns data, check whether one size is cut wrong |
| Not as expected or looks different | Photos, colour or description do not match reality | Real customer photos, true colour in natural light, video of the product in use |
| Changed mind | Low commitment purchase, often discount led | Review the offer driving these orders |
| Damaged or defective | Packaging or supplier quality | Packaging test, supplier claim, batch tracking |
| Arrived late | Gift or event purchase missed its date | Clear delivery dates at checkout |
Illustrative cases
The hero jumpsuit was paying for the whole store's returns bill
- What the dashboard said
- The jumpsuit was 38% of revenue at a 2.7x Meta ROAS, well above the account target of 2.4x.
- What was actually happening
- The jumpsuit's return rate was 34%, against 12% for the rest of the store. Two sizes accounted for more than half of its returns, and "runs long" was the top comment. After returns, its break-even ROAS was about 3.4x, so every dollar of ads behind it lost about twenty cents in contribution.
- Decision
- Fix Add fit notes and model heights to the product page, shorten the pattern on the next production run, and set a separate 3.5x ROAS target for jumpsuit ads until the return rate falls.
A product can be the best seller and the worst earner at the same time. Revenue rankings will never show it.
Shade returns came from one channel
- What the dashboard said
- A blended 17% return rate on foundation, treated as normal for the category.
- What was actually happening
- Customers acquired from broad Meta prospecting returned 26% of foundation orders for "wrong shade". Email and search customers returned 8%. Prospecting ads showed three shades; the product came in 30.
- Decision
- Test Test a shade finder before add-to-cart for prospecting traffic only, and track return rate by channel for 90 days.
Return rate is often a targeting and information problem, not a product problem.
What to do this week
- Export orders and refunds from 60 to 120 days ago, with SKU, variant and first-order channel (UTM or discount code).
- Calculate return rate by SKU and by variant, by units and by revenue.
- Cost one return properly with your 3PL, carrier and payment processor numbers.
- Rebuild break-even ROAS for your top ten SKUs after returns.
- Split return rate by first-order channel and by discount code.
- Read the return reasons for your two worst SKUs and fix the product page before touching the budget.
Questions founders ask
What is a normal return rate for ecommerce?
The NRF expected 19.3% of online purchases to be returned in 2025, against 15.8% for retail overall. Category matters far more than the average: apparel and footwear usually sit well above it, consumables and many home products well below. Compare yourself with your own history by product rather than with a blended benchmark.
How do I calculate the true cost of a return?
Add the outbound shipping you already paid, the return label, receiving and restocking fees, the value lost on items you cannot sell as new, payment fees your processor keeps, and service time. Then add back the ad spend that bought the order, because that acquisition cost is gone even though the sale was reversed.
Should I charge for returns?
Charging a small return fee or offering free exchanges but paid refunds can cut return costs, but it can also lower conversion, since most shoppers weigh free returns heavily. Test it on the products with the worst return economics first rather than across the store.
Do returns affect sales tax?
Yes. Refunded sales tax generally reduces the taxable sales you report for the period of the refund. Keep refunds linked to the original order and ship-to state, and check the treatment of partial refunds and store credit with your tax provider.
How do returns change break-even ROAS?
They lower the revenue you keep and add a cost per return, so contribution per order falls and break-even ROAS rises. A product with a high gross margin and a high return rate can need a higher ROAS than a lower margin product that rarely comes back.