- When a brand sells on Shopify and Amazon, each channel usually has its own dashboard, its own owner and its own definition of success. Both can report growth while total new customers stay flat.
- Compare channels on contribution per order after every fee, not on revenue or ROAS. A $40 order can leave you a very different amount depending on where it was placed.
- Four numbers show whether a channel is growing the brand or trading customers with the other: new customers in total, branded share of Amazon ad sales, TACoS next to DTC new-customer ROAS, and repeat behaviour in each channel.
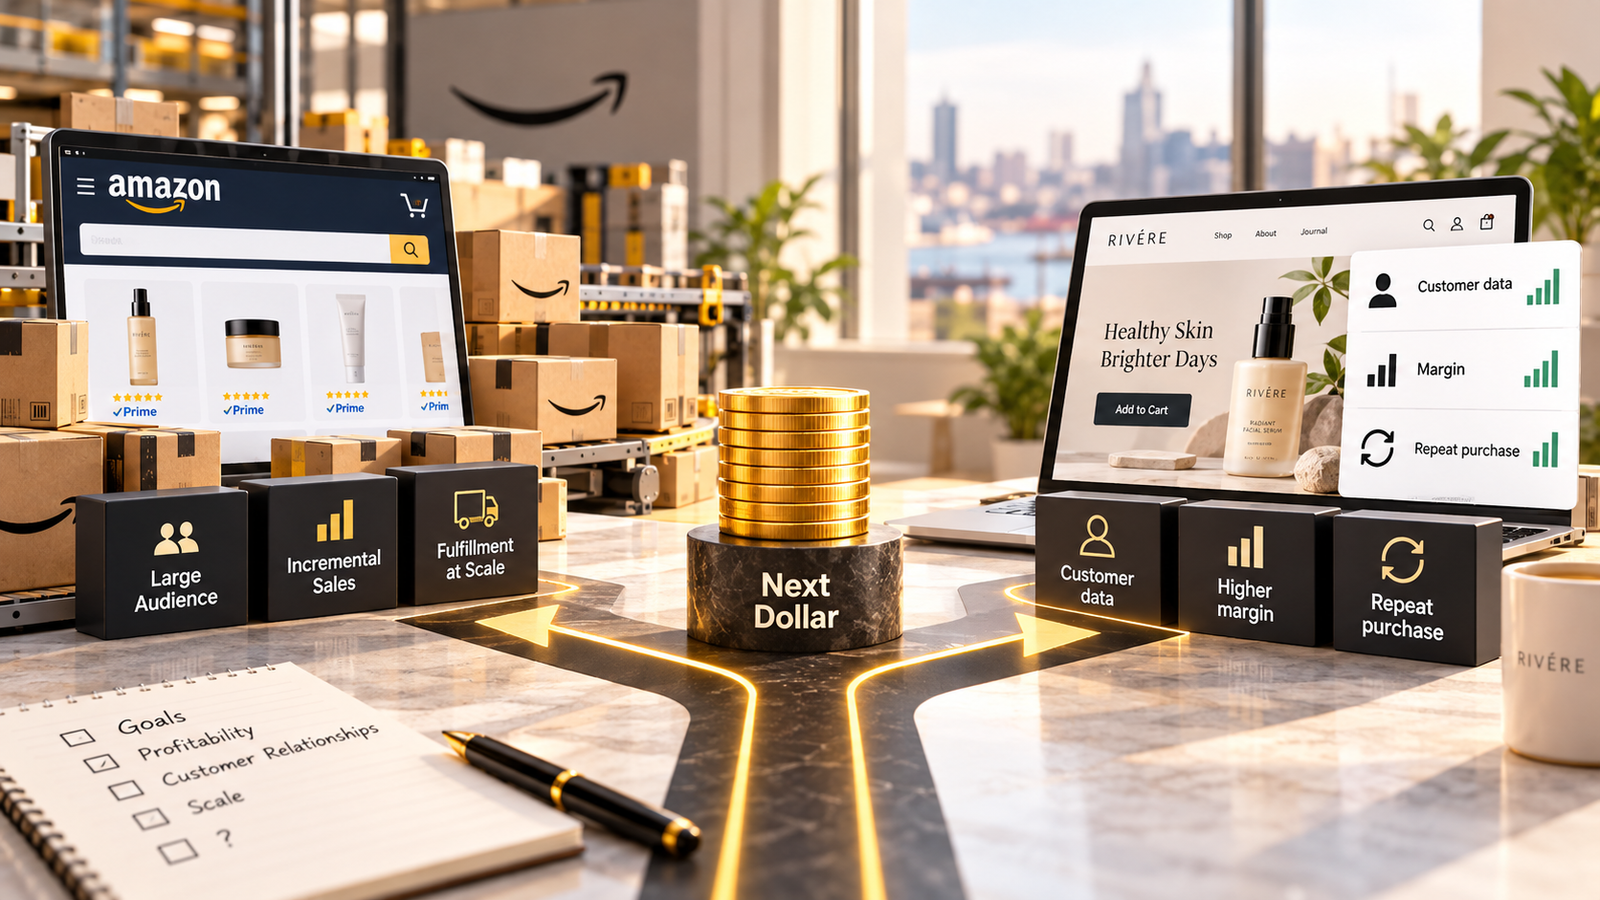
- The next dollar belongs where it buys the most new customers multiplied by what those customers earn you over 90 days. That answer changes with season, product and inventory, so review it quarterly.
- Amazon's 2026 fee update added an average of $0.08 per unit in FBA fees from January 15, 2026. Small per unit, but it compounds on low-price products and should be in your channel model.
In this article
- Why both dashboards can be green while the brand stands still
- Start with what an order actually earns you
- The four numbers to put side by side
- Is the channel growing the brand or trading customers?
- How to decide where the next dollar goes
- When stock is limited, the channel choice is an inventory choice
- What is different in 2026
- The bigger point: one brand, one scoreboard
- Questions founders ask
The monthly call has two slides. The Amazon agency shows sales up 60% for the quarter, TACoS steady, ranking improving. The founder, who runs Meta and Shopify herself, shows DTC flat but profitable. Everyone agrees that Amazon is "the growth channel" and that more budget should go there.
Nobody on the call has a slide that adds the two channels together. If they did, they would see that total new customers across both channels grew by about 10%, not 60%. Much of Amazon's growth came from people who used to buy on the website: the same customers, now paying Amazon's fees instead of the brand's shipping, and no longer on the email list.
This is the most common blind spot we see in brands that sell in both places. Each channel is measured by its own tool, owned by its own person, and judged against its own past. The business, which is the sum of both, is not measured by anyone.
Why both dashboards can be green while the brand stands still
Amazon Seller Central measures Amazon. Shopify measures Shopify. Neither knows the other exists. So three things happen that neither dashboard will show you:
- Customers move between channels. A customer who found you on Instagram and ordered twice on your site may order the third time on Amazon because it is faster with Prime. DTC loses a repeat order, Amazon gains a "new customer".
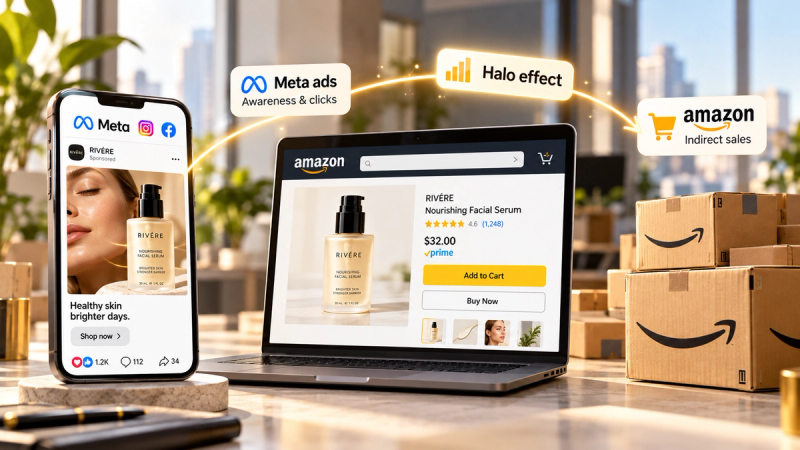
- Ads in one channel sell in the other. Meta and TikTok ads lead a meaningful share of people to search for you on Amazon. Haus, which runs incrementality tests for brands, found that the large majority of DTC-focused campaigns it tested produced a positive lift in Amazon sales. That lift is invisible in Meta ROAS and gets credited to Amazon ads or organic rank.
- Branded search takes credit. On Amazon, someone typing your brand name was very likely to buy you anyway. If a large share of Amazon ad sales comes from those searches, Amazon ROAS looks excellent while adding little.
None of these are problems in themselves. Halo is good. Customers buying wherever they prefer is fine. The problem is making budget decisions as if the channels were independent businesses.
Start with what an order actually earns you
Before comparing growth, compare the economics of a single order. Here is the same $40 product sold in each channel. The numbers are illustrative but close to typical for a small, light consumable sold through Fulfillment by Amazon.
Illustrative small consumable, per order, in dollars
Illustrative. DTC: shipping $6.50, pick and pack $2.90, payment fees about $1.20. Amazon: 15% referral fee $6.00 and FBA fee about $5.50. Ad cost per order differs because Amazon shoppers arrive with purchase intent.
| Label | Product cost | Fees, shipping and fulfilment | Ad cost per order | Contribution |
|---|---|---|---|---|
| DTC (Shopify) | $10 | $10.6 | $12 | $7.4 |
| Amazon (FBA) | $10 | $11.5 | $6 | $12.5 |
On these numbers, the Amazon order earns more. That surprises many founders, who assume the website is always more profitable because there is no referral fee. In reality, DTC often carries a higher ad cost per order, because you are paying to find people who are not already shopping.
But a single order is only half the picture. The other half is what happens next.
| DTC (Shopify) | Amazon | |
|---|---|---|
| Customer email and phone | Yes, you own the relationship | No, Amazon owns it |
| Repeat purchase tools | Email, SMS, subscriptions, loyalty | Subscribe and Save, Brand Tailored Promotions, limited follow-up |
| Repeat data | Full order history per customer | Aggregated reports such as Brand Analytics Repeat Purchase Behavior |
| Price control | Full | Shared with Amazon's pricing rules and competing sellers |
| Fee changes | Your carriers and apps | Amazon's annual fee update; FBA fees rose an average of $0.08 per unit from January 15, 2026 |
| Customer acquisition cost | Usually higher | Usually lower for products people already search for |
So the honest comparison is not "which channel has better margins?" It is: for the next dollar, which channel buys more new customers, multiplied by what those customers are worth over the next 90 days?
The four numbers to put side by side
1. New customers in total, not per channel
Count new DTC customers from Shopify (first-time buyers) and new-to-brand customers on Amazon (Amazon Ads reports new-to-brand orders for sponsored ads, and Brand Analytics gives broader customer data). Add them together each month. This total is the number that tells you whether the brand is growing. If Amazon grows by 300 new customers while DTC loses 250, the brand gained 50.
New customers per month by channel and in total (illustrative snack brand)
Illustrative composite. Amazon new-to-brand is a proxy: some of those buyers had previously bought on the website.
| Label | Total new customers | Amazon new-to-brand | DTC new customers |
|---|---|---|---|
| Jan | 2,100 | 800 | 1,300 |
| Feb | 2,150 | 920 | 1,230 |
| Mar | 2,180 | 1,050 | 1,130 |
| Apr | 2,230 | 1,180 | 1,050 |
| May | 2,260 | 1,290 | 970 |
| Jun | 2,310 | 1,400 | 910 |
2. Branded share of Amazon ad sales
In your Amazon search term report, split ad sales into searches that contain your brand name and searches that do not. Branded searches are customers who already know you. If more than about half of Amazon ad sales are branded, a large part of your Amazon ad budget is protecting sales rather than creating them. Some protection is sensible. Most brands overpay for it.
3. TACoS next to DTC new-customer ROAS
These are the two numbers that show how dependent each channel is on advertising. TACoS (Amazon ad spend divided by total Amazon sales) falling while sales rise means ads are building organic rank. On DTC, new-customer ROAS (first-order revenue from new customers divided by ad spend) shows what acquisition costs. Read them together each month, and remember that Meta spend is partly feeding Amazon.
4. Repeat behaviour in each channel
On DTC, you can measure 60 and 90-day repeat rate per cohort directly. On Amazon, the Repeat Purchase Behavior report in Brand Analytics shows how often customers rebuy each product. If Amazon customers repeat at a similar rate, the margin difference is all that matters. If DTC customers repeat far more, because your email and subscription flows are doing their job, DTC deserves more acquisition budget than its first-order ROAS suggests.
Is the channel growing the brand or trading customers?
| Signal | Trading customers | Genuinely growing the brand |
|---|---|---|
| Total new customers | Grow much less than the faster channel | Grow close to the sum of both channels |
| DTC repeat orders | Fall in the same months Amazon grows | Stable or growing |
| Branded share of Amazon ad sales | High and rising | Moderate; non-branded and category terms drive growth |
| Where growth comes from | Existing customers switching for convenience | Non-branded search, prospecting and new regions |
| Email list growth | Slowing | Growing alongside sales |
If most of your signals are in the middle column, Amazon is mostly becoming a more expensive checkout for customers you already had. That is not a reason to leave Amazon. It is a reason to stop funding its branded growth at the expense of new customer acquisition.
Amazon growth was mostly DTC customers switching channels
- What the dashboard said
- Amazon was up 60% this quarter, while DTC was flat. The plan was to move budget to Amazon.
- What was actually happening
- 41% of new Amazon buyers came from regions where DTC already sold well, and DTC repeat orders had dropped in those same regions.Most Amazon ad sales came from branded search.
- Decision
- Fix Cut branded search bids on Amazon and move that budget to DTC prospecting, with a subscription offer that matched Amazon's convenience.
Two channels growing is not the same as the brand growing. Add them together before deciding.
Read the full version in our case study on Amazon and DTC switching. For the other side of the coin, how your Meta ads quietly sell on Amazon, see our guide to the Amazon halo effect.
How to decide where the next dollar goes
Here is the process we use with brands selling in both places.
- Build one monthly table with new customers, contribution per order and 90-day repeat for each channel, plus the total. If two people own the channels, they look at the same table.
- Test branded Amazon spend. Lower bids on branded campaigns by half for two weeks. If total brand sales on Amazon barely move, that budget was protecting sales you already had.
- Measure the halo before cutting Meta. If you pause Meta for a test region, watch Amazon sales in that region too. Otherwise you will undervalue Meta and overvalue Amazon.
- Use the one-line comparison above to decide where the next $1,000 goes, using marginal numbers from step tests, not averages.
- Give each channel a job. A common, sensible split: DTC for acquiring customers you can build relationships with and for subscriptions; Amazon for capturing existing demand, Prime shoppers and people who will only buy there.
When stock is limited, the channel choice is an inventory choice
One more trade-off rarely makes it into the channel debate: inventory. Amazon rewards consistent availability. A stockout in FBA can cost you ranking that takes weeks of ad spend to rebuild, and Amazon's inventory limits and placement fees shape how much stock you can send in at once. Your own site is more forgiving: a product can go out of stock for a week and come back without losing its place.
So when a reorder is late or a hero product is running short, the question is not just "which channel earns more per order?" It is "where does a stockout hurt more?" Usually that means protecting Amazon availability for products that rank well there, and pausing DTC prospecting on the same products until stock recovers, rather than spending to acquire customers you cannot ship to. Ad budgets and inventory plans need to be made by the same person, from the same table, or one will keep undoing the other.
What is different in 2026
Fees and costs keep moving. Amazon's 2026 update raised FBA fees by an average of $0.08 per unit from January 15, 2026, with no new fee types. Small on a $40 product, bigger on a $12 one. US tariff changes during 2025 and 2026 also moved landed costs for many brands, often by different amounts in each channel because of different inventory routes. If your channel model still uses last year's costs, rebuild it. Our guide to tariffs and landed cost in 2026 shows how.
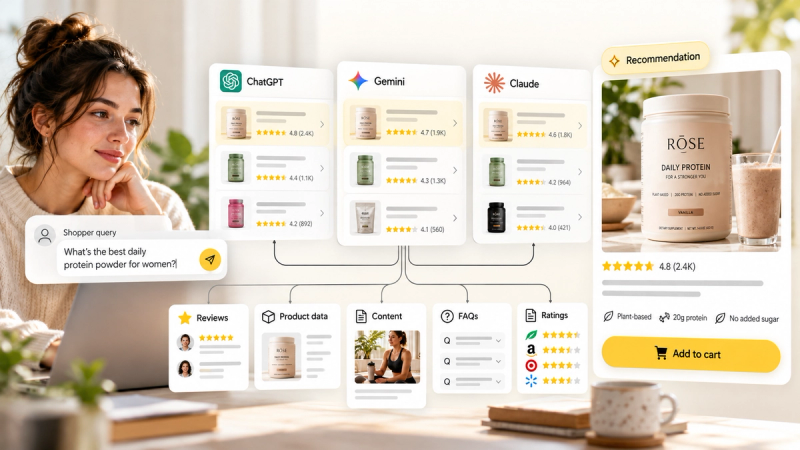
Discovery is spreading out. Shoppers increasingly find products through AI assistants, both general ones like ChatGPT and Amazon's own shopping assistant, as well as social and search. That makes click-based attribution even less complete and the total-new-customer view even more important.
Meta's measurement changed. Since March 2026, Meta counts click-through conversions only after a link click. Year-on-year Meta ROAS comparisons are not like for like, which is one more reason to judge channels on your own order data.
The bigger point: one brand, one scoreboard
Selling in two places is a strength. Measuring two places separately is a weakness. The brands that get this right do not have better channel managers. They have one table that adds the channels together and one person who decides where the next dollar goes based on it.
That joined-up table is exactly what we build in a Blindspot Snapshot: Shopify, Amazon, Meta and email data read as one business, with a clear recommendation on where to scale, fix, test and stop.
Questions founders ask
Is it more profitable to sell on Amazon or on my own website?
It depends on price point, product size and repeat behaviour. Amazon usually costs more per order in fees (referral fee plus fulfilment) but converts better and needs less ad spend to find buyers. DTC keeps more margin per order and gives you the customer's email, but usually needs more paid acquisition. Compare contribution per order after all fees and ad costs in each channel, then add what each channel's customers spend over 90 days.
What is TACoS on Amazon?
TACoS (total advertising cost of sale) is Amazon ad spend divided by total Amazon sales, including organic sales. It shows how dependent your Amazon revenue is on advertising. A falling TACoS with rising sales usually means ads are building organic rank. A rising TACoS with flat sales usually means you are paying for sales you would have had anyway.
How do I know if Amazon is cannibalising my DTC sales?
Look for three signals together: DTC repeat orders falling in the same months Amazon grows, a large share of Amazon ad sales coming from searches for your brand name, and total new customers across both channels growing much less than either channel suggests on its own. A short test pausing branded Amazon ads, or a regional comparison, can confirm it.
Should I bid on my own brand name on Amazon?
Usually some protection is worth it, because competitors bid on your brand and Amazon shows sponsored placements above your organic listing. But branded campaigns often report excellent ROAS for sales that would have happened anyway. Test it: reduce branded bids for two weeks and watch total brand sales, not just ad-attributed sales.
Should a new DTC brand launch on Amazon?
It can make sense once you have product-market fit, stable supply and enough margin to absorb referral and fulfilment fees. Many customers search Amazon first, so being absent can push them to competitors. The risk is letting Amazon become the only channel growing, which leaves you with customers you cannot email and pricing you do not fully control.