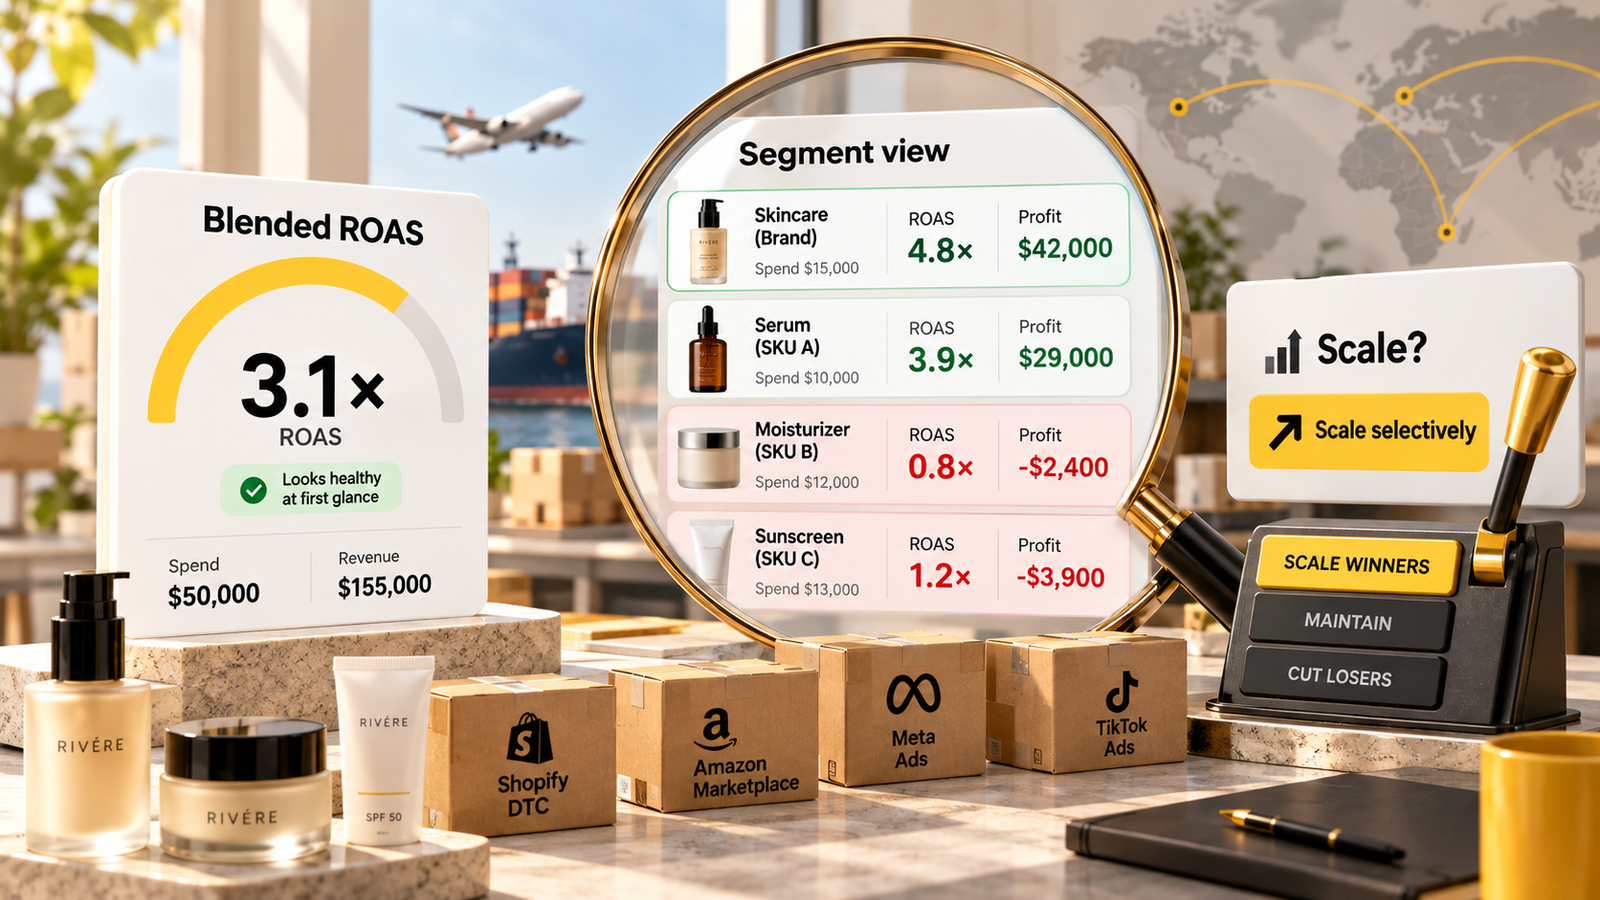
- Blended ROAS is an average of every dollar you spent last month. A scaling decision is about the next dollar, which is almost always worse than the average.
- Blended ROAS also counts returning customers, subscribers and brand searchers. Their orders do not grow when you raise prospecting spend, so a healthy blend can hide a failing acquisition engine.
- Before you scale, check three numbers: first-order ROAS from new customers against your break-even, marginal new-customer CAC from a step test, and 90-day payback by cohort.
- Meta changed how it counts conversions in March 2026 (click-through now means a link click), and its delivery system finds your existing customers on its own. Both make the customer mix in your results more important to check, not less.
- Scale when marginal nCAC sits under the contribution a new customer earns you within the time you can afford to wait. Everything else is a fix, a test or a stop.
In this article
- Why every DTC brand ended up running on blended ROAS
- Three things blended ROAS hides
- The scaling scorecard: three numbers that predict whether more spend pays back
- A worked example: the brand from the Tuesday call
- The decision matrix: scale, fix, test or stop
- What is different about scaling in 2026
- A 30-minute check you can run this week
- The bigger point: one number never makes the decision
- Questions founders ask
It is a Tuesday budget call. The founder has the Meta dashboard on one screen and the Shopify dashboard on the other. Blended ROAS for the month: 4.0x. Meta says 3.1x. Revenue is up. The agency suggests raising daily spend by 25%, and nobody on the call can think of a reason not to.
Three weeks later, revenue is up 8%. Spend is up 25%. Blended ROAS has slipped to 3.5x, which still looks fine, so the extra budget stays on. By the end of the quarter there is less cash in the bank than there was at the start, inventory has been reordered for a growth curve that did not arrive, and nobody can say exactly when it went wrong.
Nothing in that story was a bad decision based on the numbers on the screen. The numbers on the screen were simply answering a different question from the one being asked. Blended ROAS answers "how did all of last month's spend do, on average, across every kind of customer?" The scaling decision asks "what will the next dollar buy?" Those are different numbers, and in most accounts we look at, the gap between them is where the money goes.
This article is about closing that gap. It covers what blended ROAS hides, why the gap has grown since 2024, the three numbers that actually predict whether more spend will pay back, and how to pull them from Shopify and Meta this week without new software.
Why every DTC brand ended up running on blended ROAS
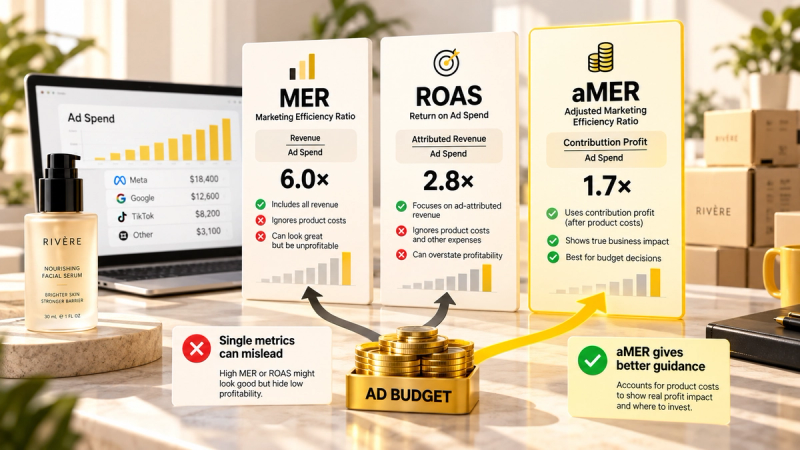
Blended ROAS (total revenue divided by total ad spend, often called MER when it includes all marketing costs) became the default for a good reason. When Apple rolled out App Tracking Transparency with iOS 14.5 in April 2021, platform-reported numbers became unreliable overnight. Founders stopped trusting the ROAS column in Ads Manager and started looking at the only numbers they controlled: money out of the bank for ads, money into Shopify.
That shift was right. Blended numbers cannot be faked by an ad platform. They include everything. The problem is that "includes everything" is exactly what makes them a poor guide for growth decisions. Revenue from a subscriber's sixth box, from a loyal customer who clicked a retargeting ad she would have bought without, and from someone who heard about you on a podcast and typed your name into Google all count the same as a new customer found by a cold prospecting ad.
The platforms have also changed a lot since 2021, and most of the changes make the mix question more important:
| When | Change | What it means for your ROAS |
|---|---|---|
| April 2021 | Apple App Tracking Transparency (iOS 14.5) | Platform ROAS loses signal. Brands move to blended ROAS and MER as the source of truth. |
| June 2024 | Audience segments (existing customers, engaged audience) available in all Sales campaigns | You can finally see how much spend and how many results went to people who already bought from you. |
| 2025 | Existing customer budget cap removed from Advantage+ campaigns | No built-in way to limit spend on existing customers. You have to exclude them manually or watch the breakdown. |
| 2025 | Incremental attribution model added as an option | Meta now offers to optimize for conversions its models think the ad caused. Useful, but still Meta grading Meta. |
| March 2026 | Click-through attribution limited to link clicks; likes, comments and engaged views move to a separate engage-through window | Click-through numbers drop for many accounts. Month-on-month ROAS comparisons across March 2026 are not like for like. |
Sources: Jon Loomer's attribution and audience segment guides (2024 to 2026). Dates are when changes reached most advertisers; rollouts were staggered.
The quiet one in that list is the removal of the existing customer cap. Meta's delivery system has always been good at finding people who are likely to buy. Your past customers are, by definition, people likely to buy. If nothing stops it, a broad Advantage+ campaign will spend a meaningful share of budget on them, report excellent ROAS, and look like it is scaling beautifully. It is not acquiring anyone. It is collecting revenue you were going to get anyway, and charging you a fee for it.
Three things blended ROAS hides
1. Who bought
The first thing blended ROAS hides is the customer mix. Here is a pattern we see in almost every account where growth has stalled: spend goes up month after month, blended ROAS drifts down a little but stays "healthy", and nobody notices that new-customer revenue per dollar has been falling much faster.
Illustrative supplements brand, monthly Meta spend rising from $40K to $75K
Illustrative composite based on patterns we see in DTC accounts. Returning-customer revenue grew with the customer base and carried the blended number.
| Label | Blended ROAS (all Shopify revenue / ad spend) | New-customer first-order ROAS |
|---|---|---|
| Apr | 4.38x | 1.75x |
| May | 4.24x | 1.69x |
| Jun | 4.14x | 1.64x |
| Jul | 4.07x | 1.56x |
| Aug | 4x | 1.5x |
| Sep | 3.46x | 1.38x |
The blended line moves from 4.4x to 3.5x over six months. Uncomfortable, not alarming. The orange line tells a different story: every month, a dollar of ad spend bought less new-customer revenue, and the brand was below its first-order break-even the whole time. That can be fine if repeat purchases pay the acquisition back quickly. It is not fine if nobody is checking.
Returning-customer revenue grows on its own as your customer base grows. It shows up in the blended numerator whether or not ads had anything to do with it. That is why blended ROAS is most misleading at exactly the moment you are deciding to scale: after a year or two of healthy acquisition, when the returning base is large enough to cover for a weakening top of funnel.
2. The difference between the average dollar and the next dollar
The second thing blended ROAS hides is diminishing returns. Every channel has a response curve: the first $10K a month reaches the people most likely to buy, the next $10K reaches people slightly less likely, and so on. Google's open-source marketing mix model, Meridian, builds this in explicitly as saturation. Ad platforms do not show it to you at all.
A blended ROAS of 4.0x at $60K a month is the average of all those dollars, including the cheap early ones. The question is what the dollars between $60K and $75K will do, and the honest answer is always "less than the average". The only question is how much less.
Marginal cost per new customer at each spend step, illustrative brand
Illustrative, modelled on a typical saturation curve. The average CAC across all $75K was about $54, close to target. Every block of spend above $40K bought customers at $72 or more.
| Label | Marginal new-customer CAC |
|---|---|
| $0 to $40K | $43 |
| $40K to $50K | $72 |
| $50K to $60K | $77 |
| $60K to $75K | $83 |
This is the single most common scaling mistake we see. A founder looks at an average CAC of $54 against a target of $50, decides it is "roughly fine", and keeps the budget. The average is roughly fine. But everything above $40K a month is buying customers at $72 to $83, well over what they earn back in 90 days, and the average hides it because it is propped up by the cheap dollars underneath. The brand did not have a $60K a month acquisition engine. It had a $40K engine with $35K of expensive extras bolted on.
3. Time and margin
The third thing blended ROAS hides is the gap between revenue and money. A 4x ROAS on a product with 75% gross margin and a 4x ROAS on a product with 35% gross margin are completely different businesses. Neither is good or bad until you know what a customer earns you after product cost, shipping, fulfilment, payment fees, discounts and returns, and how long it takes to earn it.
If you have not calculated that number for your main products, do that before anything else in this article. We have a full walkthrough of break-even ROAS by SKU, and most founders find at least one product that needs a much higher ROAS than they assumed.
The scaling scorecard: three numbers that predict whether more spend pays back
None of what follows needs new software. It needs your Shopify orders, your ad spend by day, and an honest margin number.
Number 1: first-order ROAS from new customers
Take last month's Shopify orders. Mark each one as a first order or a repeat order (Shopify's customer type filter does this, or use whether the customer's order count equals 1 at the time of the order). Add up net revenue from first orders only, excluding tax and shipping charged. Divide by total ad spend for the same period.
That is your new-customer ROAS, sometimes called nROAS or first-order ROAS. Compare it with your break-even from the formula above. This one comparison tells you more about whether acquisition is working than any dashboard tile.
If you want the fuller version of this split, including aMER (new-customer revenue over total marketing spend), we cover it in MER vs ROAS vs aMER.
Number 2: marginal new-customer CAC
Average CAC tells you what the past cost. Marginal CAC tells you what growth will cost. You get it from a step test:
- Pick one campaign or ad set that you would scale if it worked. Note its daily spend, new customers per day and creative.
- Raise spend by 20% to 30% and change nothing else. No new creative, no new offer, no new audience. If you change three things at once, you will not know which one moved the number.
- Run it for 14 to 21 days. Ignore the first three or four days while delivery settles.
- Compare new customers per day (from Shopify, not Meta) before and after. Divide the extra spend by the extra new customers.
In the example above, raising spend from $60K to $75K a month added about 180 new customers. $15,000 divided by 180 is $83 per customer, against a $50 allowable CAC. That is the scaling answer, and it was invisible in every standard report.
For brands spending more than about $20K a month on one channel, a geo holdout makes this test much cleaner. We wrote a practical guide to incrementality testing on a small budget.
Number 3: payback by cohort
A first order below break-even is not automatically a problem. Subscription brands, consumables and anything with a strong second purchase can and should acquire at a first-order loss, as long as they know when they get the money back and can afford to wait.
To see that, group customers by the month they first bought (a cohort), and track cumulative contribution per customer at 30, 60 and 90 days. The day that line crosses your CAC is your payback point. If you have never built a cohort view, our cohort analysis guide walks through it with a spreadsheet.
A worked example: the brand from the Tuesday call
Here is the full picture for the illustrative brand from the opening, at $60K a month of Meta spend, before the 25% increase.
| Metric | Value | How it is calculated |
|---|---|---|
| Shopify revenue (net) | $240,000 | All orders, excluding tax and shipping charged |
| Blended ROAS | 4.0x | $240,000 / $60,000 |
| Meta-reported ROAS | 3.1x | Meta-attributed purchase value / $60,000 |
| Returning-customer revenue | $150,000 | Orders from customers with a previous order |
| New-customer first-order revenue | $90,000 | 1,200 new customers at $75 average first order |
| New-customer ROAS | 1.5x | $90,000 / $60,000 |
| Break-even first-order ROAS | 2.08x | 1 / 48% contribution margin |
| Average new-customer CAC | $50 | $60,000 / 1,200 |
| First-order contribution per customer | $36 | $75 x 48% |
| 90-day contribution per customer | $50 | $36 + repeat orders from 28% of customers |
| Marginal CAC on the next $15K | $83 | $15,000 / 180 extra new customers |
Illustrative composite. Contribution margin assumes 32% product cost, 12% shipping and fulfilment, 3% payment fees and 5% discounts.
Read the table top to bottom and the story changes three times. At the top, a 4x business that should scale. In the middle, an acquisition engine running below break-even on the first order but paying back at almost exactly 90 days, which is acceptable if cash allows. At the bottom, a clear signal that the next $15K would buy customers who need well over six months to pay back, if they ever do.
The right decision was not "scale" or "don't scale". It was: do not add budget, trim the weakest ad sets back towards the level where marginal CAC sits near target, fix the economics of the first order (a bundle that lifts first-order value, or a different product to lead with), and test new creative angles to find fresh pockets of demand before adding budget again. Raising spend into a flattening curve buys revenue at a loss. Changing what the ad sells moves the whole curve.
The 3.1x ROAS that was mostly subscribers reordering
- What the dashboard said
- Meta reported 3.1x ROAS on an Advantage+ campaign. The agency recommended doubling the budget.
- What was actually happening
- The audience segments breakdown showed a large share of spend and purchases going to existing customers, mostly subscribers whose renewals happened to fall inside the attribution window.Once Shopify first orders were matched against spend, new-customer ROAS was about 1.6x against a 2.0x break-even.
- Decision
- Fix Exclude existing customers from prospecting, rebuild the prospecting offer around the starter bundle, and step-test spend in 20% increments with Shopify first orders as the success metric.
If a campaign can reach your existing customers, its ROAS is partly measuring your retention, not your acquisition.
You can read the full version of this one in our case study on subscriber reorders.
The decision matrix: scale, fix, test or stop
Once you have the three numbers, the decision is usually obvious. This is the grid we use.
| If you see this | It means | Decision |
|---|---|---|
| New-customer ROAS above break-even, and marginal CAC under target after a step test | Acquisition pays on the first order and has room to grow | Scale, in 20% to 30% steps, checking marginal CAC each time |
| New-customer ROAS below break-even, but 90-day payback inside your cash runway | Acquisition works on repeat, not first order | Scale carefully, only as fast as cash allows; improve first-order value |
| Blended ROAS healthy, new-customer ROAS falling for 3+ months | Returning customers are covering a weakening top of funnel | Fix: separate existing customers, find new creative angles before adding budget |
| Marginal CAC well above target after a step test | The current offer and creative are near saturation | Test: new products to lead with, new angles, new channels; do not add budget |
| Below break-even and no payback inside 6 months | Every new customer loses money | Stop prospecting spend at this level and rework the offer or product economics |
Notice that "scale" only happens in one row. That is not pessimism. In most growth-stage accounts, the biggest wins come from the fix and test rows: changing what the ads sell, to whom, and at what first-order value. Budget is the last lever, not the first.
What is different about scaling in 2026
Three things have changed recently that make this more important than it was two years ago.
Creative is now the targeting. Meta's delivery system decides who sees your ads mostly from the ad itself. Broad targeting plus a strong creative usually outperforms clever audience building. The side effect is that one winning ad, scaled hard, tends to saturate the slice of people it resonates with. When marginal CAC jumps, the fix is usually a genuinely different creative angle (a new problem, a new customer type, a new format), not a bigger budget behind the same idea.
Your existing customers are in the auction by default. With the existing-customer cap gone, you need to check the audience segments breakdown in Ads Manager every month, or exclude purchasers from prospecting campaigns yourself. If more than about a fifth of a prospecting campaign's spend is going to existing customers, its ROAS is partly a retention number.
Attribution moved under your feet. Since March 2026, Meta's click-through window only counts conversions after a link click, and conversions after likes, comments or engaged views sit in a separate engage-through bucket. Many accounts saw reported ROAS drop with no change in actual sales. If you compare this quarter with last year in Ads Manager, you are comparing two different rulebooks. Shopify first orders are the stable baseline.
A 30-minute check you can run this week
If you only do one thing after reading this, do this:
- Export last month's orders from Shopify with the customer's order count or customer type.
- Split net revenue into first orders and repeat orders.
- Divide first-order revenue by last month's total ad spend. That is your new-customer ROAS.
- Calculate your break-even: 1 divided by the contribution margin on a typical first order.
- In Meta Ads Manager, break down your biggest Sales campaign by audience segments and note what share of spend went to existing customers.
- Write down the one number that surprised you most.
If new-customer ROAS is comfortably above break-even and existing customers are a small share of spend, you have earned the right to run a step test. If not, the next dollar has a better home than your current campaigns.
The bigger point: one number never makes the decision
Blended ROAS is not wrong. It is a fine health check for the whole business, and it is much harder to fool than platform ROAS. It just answers a backward-looking, all-customers question, and scaling is a forward-looking, new-customers question.
The founders who scale well are not the ones with the best dashboard. They are the ones who connect ad spend to orders, orders to products, and products to what those customers do over the next 90 days, and then decide. That joined-up view is what we build in a Blindspot Snapshot: ads, Shopify, Amazon and email data read together, with a plain answer on what to scale, fix, test and stop.
Questions founders ask
What is a good blended ROAS for a DTC brand?
There is no universal good number, because blended ROAS depends on your margin and on how much of your revenue comes from returning customers. A brand with 70% gross margin and a strong subscription base can be healthy at 2.5x blended, while a 40% margin brand with mostly first-time buyers can lose money at 4x. Compare blended ROAS with your own break-even (1 divided by contribution margin) and, more importantly, split out new-customer revenue before you judge it.
What is the difference between blended ROAS and MER?
Most people use them for the same calculation: total revenue divided by total paid media spend. Some teams reserve MER for total marketing spend including agency fees, tools and influencers, and blended ROAS for paid media only. Either way, both are averages across new and returning customers, which is why neither one tells you whether more spend will pay back.
What is marginal ROAS and how do I measure it?
Marginal ROAS is the revenue the next increment of spend brings in, divided by that increment. You measure it by changing spend in a controlled step, for example raising a campaign from $2,000 to $2,500 a day for two weeks while keeping creative and offer constant, then comparing new customers and new-customer revenue against the prior period and against a holdout region if you can afford one.
Should I turn off retargeting to improve new customer ROAS?
Not blindly. Some retargeting is incremental, especially for higher-priced products with a longer decision cycle. The point is to report it separately. If retargeting and existing-customer spend is mixed into prospecting results, you cannot see what acquisition is really costing. Use Meta's audience segments breakdown or separate ad sets so the numbers are not blended.
How long should a scaling test run?
Long enough to cover at least one full purchase cycle for your product and two full weeks of days, usually 14 to 21 days. Budget changes also reset some learning, so judge the second week more than the first. For products where most customers buy within a day of first seeing the ad, 14 days is usually enough.
Sources
- Jon Loomer: How Meta Ads Attribution Works in 2026
- Jon Loomer: No More Existing Customer Budget Cap
- Jon Loomer: The History of Audience Segments
- Haus: Is Meta Incremental? (analysis of 640 experiments, August 2025)
- Google Meridian: An introduction to marketing mix modeling, response curves and saturation