- Cohort analysis groups customers by when and how they were acquired and tracks what they spend afterwards. For DTC brands, the most useful cut is payback by channel and offer.
- Measure payback in contribution, not revenue. A cohort can show a 3.6x six-month revenue ROAS and still never earn back what it cost to acquire, because the discount took the margin.
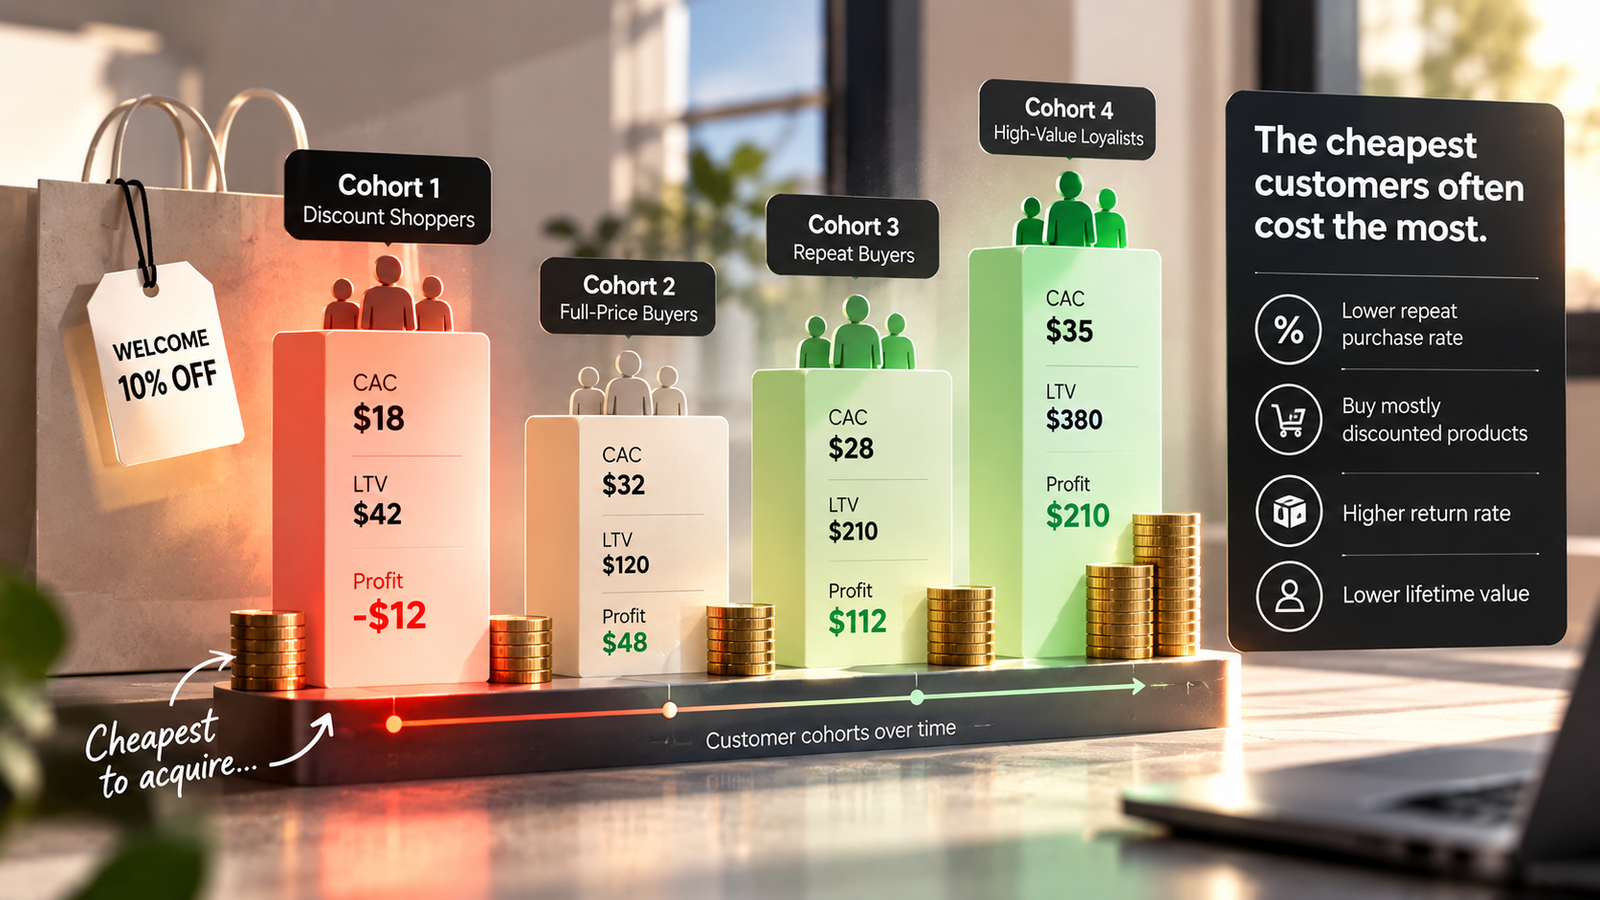
- The cheapest customers are often the most expensive. Deep-discount channels win on day-one CAC and lose on repeat rate, which research on acquisition promotions has documented for years.
- Influencer and sale codes need three checks before you renew them: how many orders came from existing customers, whether the code leaked to coupon sites or AI assistants, and whether those customers came back.
- Report holiday and code cohorts separately from your LTV average, or they quietly distort every decision built on it.
In this article
- What cohort analysis is, in plain English
- Why payback must be measured in contribution, not revenue
- The case: the supplements brand with the "best" channel
- Three checks before you renew any discount code
- Holiday cohorts need their own line
- How to build payback cohorts by channel and offer
- The KPIs that matter
- The decision
- Questions founders ask
A founder shares the influencer sheet on a call. One creator's code drove 400 orders last month at a $30 customer acquisition cost, half of what Meta costs. Black Friday was even better: a $22 CAC and a first-order ROAS close to 3x. The plan is obvious. Double the creator program, go bigger on sales, and cut back the "expensive" channels.
Six months later, the cheap customers have barely come back. The expensive ones, acquired at full price through search and Meta, have paid for themselves twice over. The brand did not have a cheap channel and an expensive one. It had channels that looked cheap on day one and channels that were cheap by month four.
That difference is only visible through cohort analysis, and it is the single most common way we see DTC brands misallocate budget. This guide shows how to build cohorts by channel and offer, why payback has to be measured in contribution rather than revenue, and the checks every discount code needs before you renew it.
What cohort analysis is, in plain English
Shopify has a customer cohort analysis report that groups customers by the month they arrived and shows retention over time. It is a good start. What it does not do is split cohorts by acquisition channel, offer or discount, and that is where the budget decisions live.
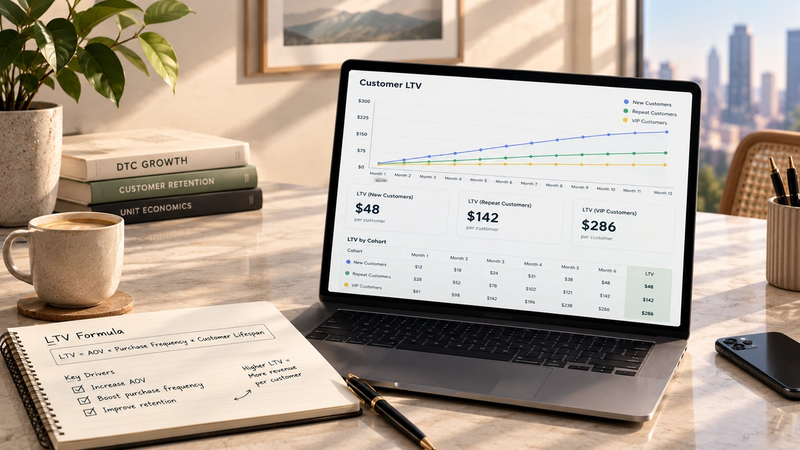
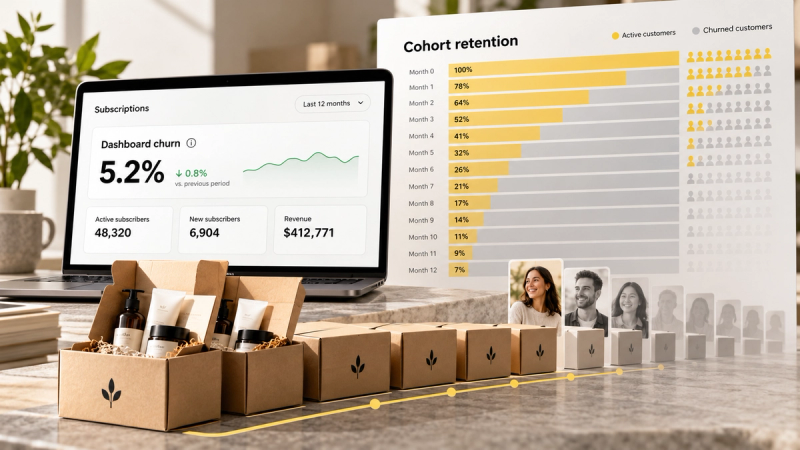
The classic view is a cohort triangle: one row per acquisition month, one column per month since first order. Read across a row to see how one cohort ages. Read down a column to see whether newer cohorts behave better or worse than older ones at the same age.
| Cohort | Customers | Month 1 | Month 2 | Month 3 | Month 4 | Month 5 |
|---|---|---|---|---|---|---|
| January | 1,240 | 9% | 17% | 23% | 27% | 30% |
| February | 1,180 | 9% | 16% | 22% | 26% | |
| March | 1,410 | 8% | 14% | 19% | ||
| April | 1,630 | 6% | 11% | |||
| May | 1,720 | 6% |
Reading down month 2: newer cohorts repeat less. In this example, April and May were the months spend increased and a 25% offer went live.
Why payback must be measured in contribution, not revenue
Most cohort dashboards show revenue per customer. That is the wrong unit for a payback decision. A customer who spends $79 with you over six months, mostly at 40% off, may leave you only $18 after product cost, shipping and fees. If you paid $22 to acquire them, they never paid back, no matter how good the revenue line looks.
The case: the supplements brand with the "best" channel
A supplements brand was choosing where to put next quarter's budget. Contribution margin is 50% at full price. Black Friday and influencer codes had the best first-order ROAS by a distance, and the plan was to double both. Here is what the cohorts showed. The figures are an illustrative composite.
| Source | CAC | First-order ROAS | 90-day repeat | 6-month revenue per customer | 6-month contribution per customer | Payback |
|---|---|---|---|---|---|---|
| Black Friday, 40% off | $22 | 2.91x | 9% | $79 | $18 | Not within 6 months |
| Influencer, 30% code | $30 | 1.40x | 11% | $58 | $20 | Not within 6 months |
| Meta, full price | $45 | 1.29x | 24% | $110 | $55 | Month 4 |
| Google Search, full price | $60 | 1.07x | 36% | $170 | $85 | Month 3 |
Cumulative contribution per customer minus CAC, by months since first order ($, illustrative)
Above the line, a cohort has earned back its acquisition cost in contribution. Illustrative composite.
| Label | Google Search | Meta | Black Friday | Influencer code |
|---|---|---|---|---|
| M0 | -$28 | -$16 | -$11 | -$18 |
| M1 | -$16 | -$10 | -$9 | -$16 |
| M2 | -$6 | -$5 | -$8 | -$14 |
| M3 | $3 | -$1 | -$7 | -$13 |
| M4 | $11 | $3 | -$6 | -$12 |
| M5 | $18 | $7 | -$5 | -$11 |
| M6 | $25 | $10 | -$4 | -$10 |
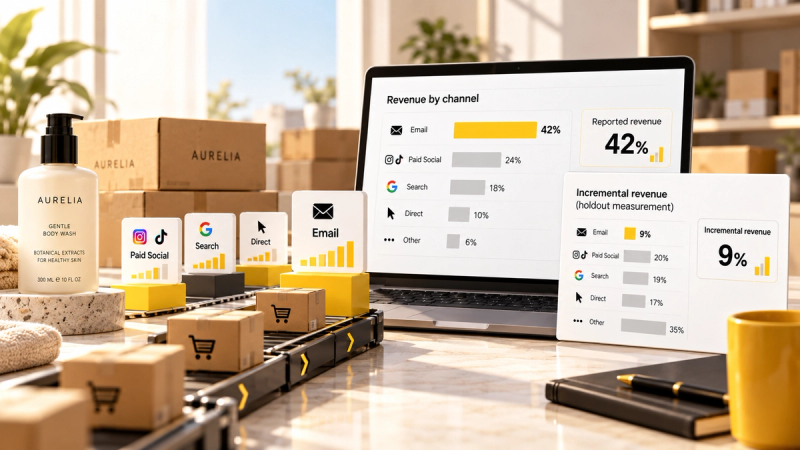
Black Friday even had the best six-month revenue ROAS of the four, at 3.59x. But the discount took most of the margin and few customers came back, so the cohort never earned back its cost. Google Search looked worst on day one, with a first-order ROAS of 1.07x, and paid back first. On closer inspection, a third of the influencer code's orders came from existing customers, which made its real cost per new customer far higher than $30.
Share of customers with a second order within 90 days, by acquisition source
| Label | 90-day repeat rate |
|---|---|
| Black Friday (40% off) | 9% |
| Influencer (30% code) | 11% |
| Meta (full price) | 24% |
| Google Search (full price) | 36% |
This is not just a pattern from our own work. A Journal of Marketing Research study of an online grocer and a newspaper found that deeper acquisition discounts led to lower repeat buying in both businesses. In one dataset, a 35% acquisition discount produced customers worth about half as much over the long run as customers acquired at full price.
Three checks before you renew any discount code
Influencer and promo codes are the channel most often credited with sales they did not create. Before renewing a creator deal or repeating a sale, run these three checks.
- How many orders came from existing customers? People who already buy from you will happily use a code they see. That is a discount on a sale you already had, not a new customer.
- Did the code leak? Codes get picked up by coupon sites. UGCBloom describes an aggregator driving 200 orders in a week on a code that normally sees 20, which looks exactly like a viral post. HelloPartner points out that shoppers now ask AI assistants for a brand's discount code and get one. The creator gets credit for sales they never touched.
- Did those customers come back? Code customers were selected by a discount. Many wait for the next one. Compare their 90-day repeat with your full-price cohorts.
Holiday cohorts need their own line
November and December cohorts behave differently from the rest of the year. More gift buyers, deeper discounts, more one-time shoppers. If you average them into your LTV, two things go wrong: your LTV estimate drops and makes good channels look worse, and your first-quarter reporting looks like a retention collapse when it is just the holiday cohort ageing.
Report Black Friday and holiday cohorts on their own, and check them again in March. If they reorder at full price, great: those sales were worth it. If they only come back for the next sale, plan next year's promotion with that cost in mind.
How to build payback cohorts by channel and offer
- Export 12 months of orders with customer ID, date, discount code, UTM source and refunds.
- Tag each customer by the channel and offer of their first order. Treat each significant code as its own group.
- Build cohorts by acquisition month and channel, with at least 100 customers each.
- Calculate cumulative contribution per customer for each month since the first order.
- Calculate CAC by channel using Shopify new-customer counts, not platform-reported conversions, and find each cohort's payback month.
- For every code, check the share of orders from existing customers and any sudden spikes that look like leakage.
The KPIs that matter
| Metric | Formula | What it tells you |
|---|---|---|
| CAC by channel and offer | Channel spend / new customers from that channel in Shopify | True cost per new customer |
| New-customer share of code orders | First-time buyers using the code / all orders with the code | How much of a code's volume is really new |
| 90-day repeat by source | Customers reordering within 90 days / customers acquired | Customer quality by channel |
| 6-month contribution per customer | Cohort contribution in 6 months / customers | What each source is worth after discounts |
| Payback month | First month cumulative contribution passes CAC | When the money comes back |
| Second-order window | Median days between first and second order | When to send the reorder email |
The decision
| Decision | What to do |
|---|---|
| Scale | The channel with the fastest contribution payback, until its marginal CAC approaches its six-month contribution. |
| Fix | Deep-discount acquisition offers. Test a free gift or sample at a similar cost, and compare 90-day repeat. |
| Test | Move 15% of your largest channel's budget to the fastest-payback channel for six weeks. |
| Stop | Averaging holiday and code customers into one LTV number, and renewing codes on redemption counts alone. |
The supplements brand with the "best" channel
- What the dashboard said
- Black Friday and influencer codes had the best first-order ROAS. The plan was to double both.
- What was actually happening
- Neither discounted cohort paid back within six months. Google Search, with the worst first-order ROAS, paid back in month three. A third of the influencer code's orders came from existing customers.
- Decision
- Test Move budget towards Search in a six-week test, replace the influencer code with a free sample offer at similar cost, and report Black Friday customers as their own cohort.
The cheapest customer is often the most expensive one. Judge payback on contribution, never revenue.
Cohorts become even more useful when you add a second cut: what customers bought first, and whether they used a welcome code. We cover both in customer value by first product and welcome discounts and bargain hunters. Building these cohorts across every channel, code and product is a core part of a Blindspot Snapshot, and usually the part that changes the budget the most.
Questions founders ask
What is cohort analysis in ecommerce?
Cohort analysis groups customers who share a starting point, usually the month and channel of their first order, and tracks their behaviour over time: repeat rate, revenue and contribution per customer. It shows whether newer customers are as valuable as older ones and which acquisition sources produce customers who come back.
What payback period should a DTC brand aim for?
It depends on how you fund growth. If ad spend and inventory come out of cash flow, payback has to arrive before that cash runs out, which for most early-stage brands means three to six months. Brands with investor funding or high-margin subscriptions can tolerate longer payback, as long as they know exactly when the money comes back.
Should I use LTV or payback for budget decisions?
Payback. LTV is a forecast that is easy to inflate and slow to verify. Payback tells you when the cash comes back, which is what limits how fast you can grow. Use LTV to sense-check, payback to decide.
How many customers does a cohort need?
At least 100 per channel per period, ideally more. If a channel is small, combine two or three months into one cohort rather than reading noise from a group of 30 customers.
Are discounts always bad for customer quality?
No. Depth matters more than whether you discount at all. A 10% welcome offer often behaves very differently from a 40% sitewide sale. Compare cohorts by discount level before deciding.
Sources
- Lewis, M. (2006). Customer Acquisition Promotions and Customer Asset Value. Journal of Marketing Research
- UGCBloom: How to track sales from influencer promo codes
- HelloPartner: The truth behind those high-performing influencer codes
- Stack Influence: How to use influencer discount codes in 2026
- Shopify Changelog: Customer cohort analysis report