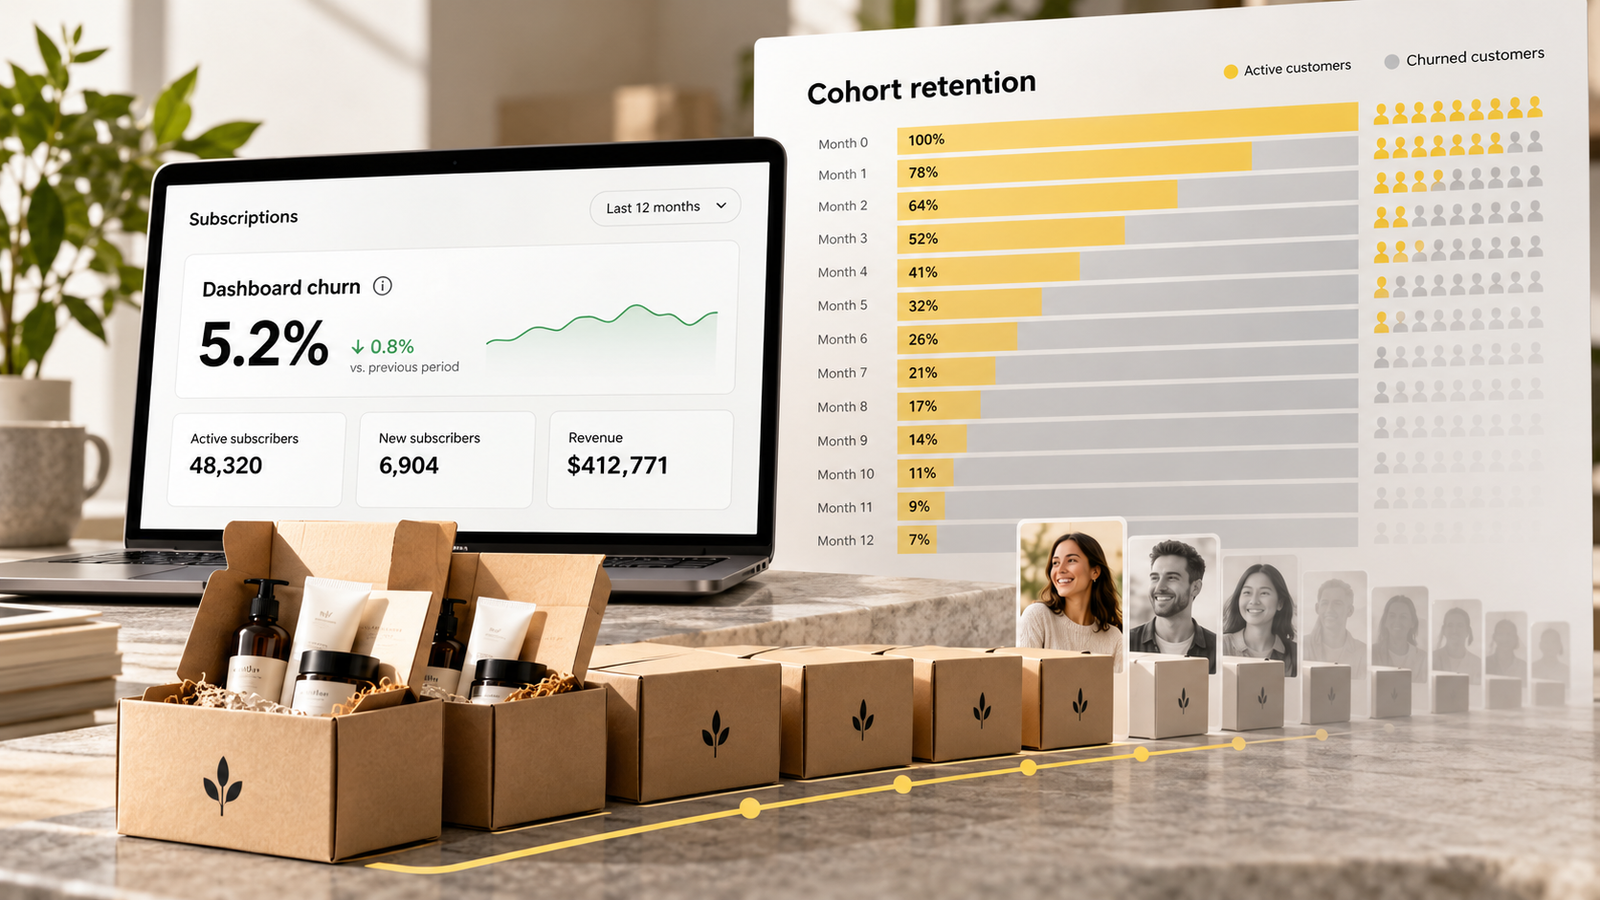
- Blended monthly churn averages loyal long-term subscribers with brand new ones. New subscribers usually churn several times faster, so the blended number looks healthier than your acquisition really is.
- The number that decides whether subscription acquisition pays is second-shipment retention: the share of new subscribers who take their second order.
- Paused and repeatedly skipped subscribers are often counted as active. Treat long pauses as churn in your reporting.
- Failed payments are a large, fixable part of churn. Published benchmarks put payment-related churn at 12% to 42% of total churn.
- The FTC's click-to-cancel rule was vacated in 2025, but cancellation rules still apply through federal enforcement and state auto-renewal laws. Easy cancellation is a legal requirement, not a retention tactic to avoid.
In this article
A supplements founder has a subscription programme she is proud of. Monthly churn has held at around 6% for a year, comfortably inside published benchmarks. So when the agency suggests a bolder first-box offer, 40% off, to accelerate sign-ups, it feels like a safe bet on a healthy programme. Sign-ups jump. Everyone celebrates.
Three months later, blended churn has crept up to 8% and nobody is sure why. The answer is that it was never 6% for new subscribers. Loyal subscribers who had been around for years were churning at 3% and holding the average down. New subscribers were leaving at five times that rate, and the new offer had nearly half of them gone before their second box. The healthy programme was a loyal core wrapped around a leaky front door.
Subscription dashboards usually open with one number: monthly churn. It sits at 5% or 6%, it has barely moved in a year, and it makes the programme look stable. For many brands it is the most misleading number in the business.
The problem is not the calculation. It is what gets averaged together. This article shows how to split churn by cohort, where the hidden churn sits (pauses, skips, failed cards and first-order offers), and how to calculate subscriber value without inflating it.
What published benchmarks say
Benchmarks for consumer subscriptions cluster in a narrow range. An analysis of public and platform data by Eightx cited Recurly's consumer benchmark at about 6.5% monthly churn and a Recharge DTC panel at 7.1% (4.1% voluntary and 3.0% involuntary). By model, replenishment subscriptions (coffee, supplements, pet food, personal care) tend to sit around 4% to 7% a month, while curated boxes run higher at around 8% to 12%.
These are useful for orientation. They tell you almost nothing about whether your acquisition is working, because they are blended averages too.
Why blended churn flatters you
| Group | Active at start of month | Monthly churn | Cancellations |
|---|---|---|---|
| Subscribers 6+ months old | 3,500 | 3% | 105 |
| Subscribers under 6 months | 1,500 | 15% | 225 |
| Total | 5,000 | 6.6% blended | 330 |
Illustrative. Two-thirds of cancellations come from the newest 30% of subscribers.
Monthly churn by subscriber age in the illustrative base above
| Label | Monthly churn |
|---|---|
| Subscribers 6+ months old | 3% |
| Subscribers under 6 months | 15% |
| Blended (what the dashboard shows) | 6.6% |
A 6.6% churn rate sounds fine. But if your growth plan depends on new subscribers, the relevant number is 15%, and it may be much higher in the first two months. As long as older, loyal subscribers make up most of the base, the blended rate hides what is happening to new cohorts. When acquisition speeds up, the new share of the base grows and blended churn rises, often to the surprise of everyone watching only the headline.
Read churn by cohort
Group subscribers by the month they joined. For each cohort, track the share still active after each shipment. This is the view that shows whether a new offer, channel or product change actually improved retention.
| Cohort | After shipment 1 | After shipment 2 | After shipment 3 | After shipment 6 |
|---|---|---|---|---|
| 40% off first box (Meta) | 100% | 54% | 41% | 26% |
| 15% off first box (Meta) | 100% | 71% | 60% | 43% |
| Converted from a one-time order | 100% | 82% | 74% | 58% |
Illustrative. "After shipment 2" means the subscriber was billed and shipped a second time.
Share of each cohort still active after each shipment (illustrative)
| Label | Converted from a one-time order | 15% off first box | 40% off first box |
|---|---|---|---|
| Shipment 1 | 100% | 100% | 100% |
| Shipment 2 | 82% | 71% | 54% |
| Shipment 3 | 74% | 60% | 41% |
| Shipment 6 | 58% | 43% | 26% |
The 40% off offer brought in the most subscribers, but nearly half left before a second shipment. Many were buying a cheap first box, not joining a subscription. The customers who converted to subscription after a one-time order stayed far longer, because they already knew they liked the product. This is the same pattern we see with first products in one-time purchases, covered in The first product a customer buys decides what they are worth.
| Offer | CAC per new subscriber | Second-shipment retention | Cost per subscriber reaching shipment 2 |
|---|---|---|---|
| 40% off first box | $38 | 54% | $70 |
| 15% off first box | $52 | 71% | $73 |
| 15% off plus gift on third box | $55 | 78% | $71 |
Illustrative. The cheapest acquisition offer is not the cheapest way to get a real subscriber, and it also gives away more margin on the first box.
CAC per new subscriber vs cost per subscriber who reaches shipment 2, by offer
Judge offers on cost per retained subscriber. On that measure, all three are close, and the 40% offer brings the weakest cohort.
| Label | CAC per sign-up | Cost per subscriber reaching shipment 2 |
|---|---|---|
| 40% off first box | $38 | $70 |
| 15% off first box | $52 | $73 |
| 15% off plus gift on third box | $55 | $71 |
Where hidden churn sits
Pauses and skips
Most subscription apps let customers pause or skip instead of cancelling. That is good for retention, but it breaks reporting if a subscriber who has paused for four months is still counted as active. In your reporting, treat a pause longer than roughly two normal delivery intervals, or three skips in a row, as churn. Keep them in a win-back segment, and count them as recovered if they restart.
Failed payments
Cards expire, get replaced after fraud, or hit limits. Eightx's analysis cites payment-related churn at 12% to 42% of total churn, and recovery rates of around 49% for a basic setup rising to around 71% for an optimised one (smart retries, card updater services, and dunning emails and SMS that make updating a card easy).
First-order offers that attract the wrong subscriber
Heavy first-box discounts, free gifts worth more than the first box, and "cancel anytime" messaging in ads all raise sign-ups and lower second-shipment retention. None of them are wrong on their own. They just need to be judged on cost per retained subscriber, not cost per sign-up.
Subscriber lifetime value without the inflation
The standard shortcut, average revenue per subscriber per month divided by monthly churn, uses blended churn and so overstates the value of a new subscriber. A 6.6% churn gives an average life of about 15 months. A new subscriber in the example above, facing 15% monthly churn in the first six months, is worth far less.
Illustrative cases
The best-performing offer was producing one-box subscribers
- What the dashboard said
- A 40% off first box offer cut subscription CAC by a third. Blended churn stayed at 6%.
- What was actually happening
- Only 52% of subscribers from the new offer reached a second shipment, against 73% for the previous offer. Because older subscribers made up most of the base, blended churn barely moved for four months. By month five it had risen to 8.4% as the new cohorts grew as a share of the base.
- Decision
- Fix Move to 15% off the first box with a gift on the third shipment, and report cost per subscriber reaching shipment 2 as the main acquisition metric.
Judge a subscription offer at shipment two, not at sign-up.
19% of "active" subscribers had not been billed in two months
- What the dashboard said
- 4,800 active subscribers and 4.5% monthly churn.
- What was actually happening
- About 900 subscribers were on pauses longer than 60 days or had skipped three times in a row. Counting them as churned raised the true monthly churn to roughly 7%. Separately, 31% of cancellations were failed payments, and fewer than half were recovered.
- Decision
- Fix Report long pauses as churn, send paused subscribers a win-back sequence with a limited new roast, and fix payment retries and card updater settings.
A subscriber you cannot bill is not an active subscriber, whatever the dashboard calls them.
What to do this week
- Build a cohort table by sign-up month showing the share still active after shipments 1, 2, 3 and 6.
- Calculate second-shipment retention and cost per retained subscriber for each acquisition offer and channel.
- Count subscribers paused more than two delivery intervals or with three consecutive skips, and report them separately.
- Check the share of cancellations caused by failed payments and your recovery rate.
- Recalculate subscriber value from your cohort curve and contribution, not blended churn and revenue.
- Review your cancellation flow and renewal notices against the states you sell into.
Questions founders ask
What is a good monthly churn rate for a DTC subscription?
Published consumer benchmarks sit around 6.5% to 7% a month on average, with replenishment products typically lower (around 4% to 7%) and curated boxes higher (around 8% to 12%). More important than the blended rate is how quickly new cohorts churn in their first three shipments.
Should paused subscribers count as active?
For short pauses, yes. For pauses longer than about two normal delivery intervals, or three consecutive skips, it is more accurate to report them as churned and count them as recovered if they restart.
How do I reduce involuntary churn?
Use smart payment retries timed to when cards are likely to succeed, a card updater service, and short, clear dunning emails and SMS with a one-tap way to update payment details. Many brands recover a large share of failed payments with these basics.
Is the FTC click-to-cancel rule in effect?
No. The Eighth Circuit vacated it in July 2025, and the FTC has since restarted the rulemaking process. Difficult cancellation can still lead to FTC action under ROSCA and to claims under state automatic renewal laws, so easy online cancellation remains the safe approach.
How should I calculate subscription LTV?
Use your own cohort retention curve and contribution per active subscriber for each month, summed over a fixed period such as 12 or 24 months. Dividing average revenue by blended churn usually overstates what a new subscriber is worth.