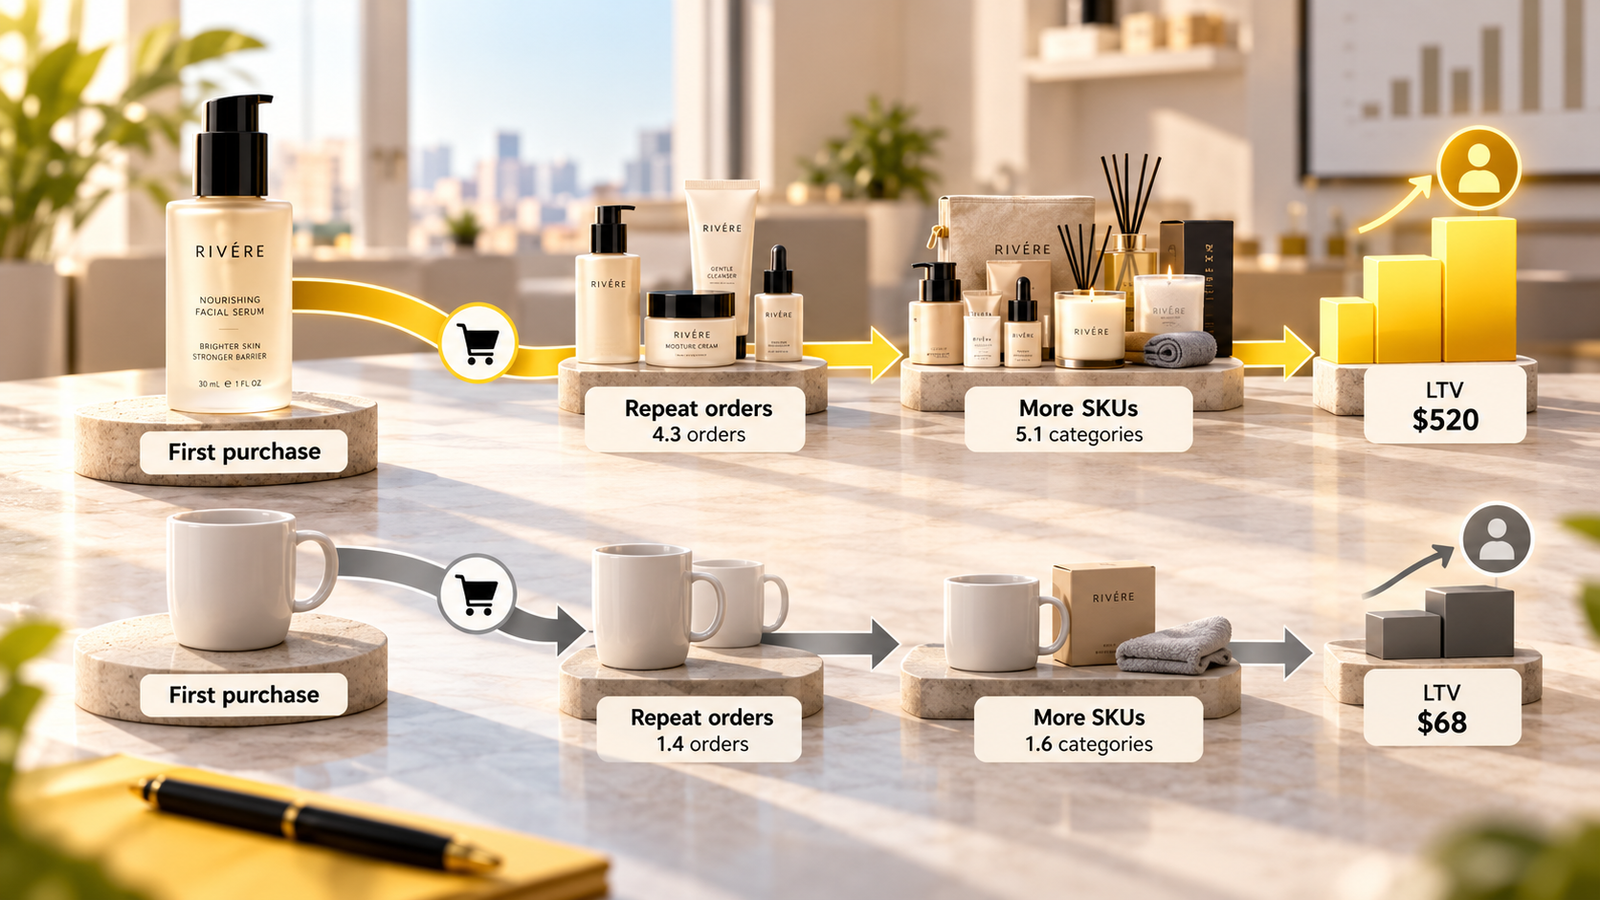
- The product in a customer's first order is one of the strongest early predictors of what that customer will be worth. Two customers acquired at the same CAC can differ by 2x in 90-day value depending only on what they bought first.
- Shopify's product reports rank by revenue and units. They never show what each product's buyers do next, so the product with the most ad budget is often chosen for its first-order ROAS alone.
- The analysis takes one order export: tag each customer with their first product, then compare repeat rate, 90-day revenue and 90-day contribution per customer for each entry product.
- Most catalogs split into four types of entry product: gateways, dead ends, gift sets and samplers. Each one needs a different role in your ads and post-purchase flows.
- With Meta's delivery now driven largely by the creative, the product your ad shows decides who you reach. Choosing the lead product is a targeting decision, not just a merchandising one.
In this article
- Why your product reports cannot answer this
- What the analysis usually shows
- How to run the analysis, step by step
- The four kinds of entry product
- Why this matters more in 2026 than it did before
- What changes after you know the answer
- What the budget shift looked like in numbers
- Common traps in a first-product analysis
- The point: products create customers, not just revenue
- Questions founders ask
A specialty coffee brand runs most of its Meta budget behind a holiday gift set. It is the obvious choice. The set has the highest order value in the store, the best first-order ROAS in the ad account, and the prettiest product shots. It sits at number one in Shopify's "top products" report every month from October to January.
Then someone builds a simple table. For every customer acquired in the past year, it records the first product they bought and what they spent in the following 90 days. The gift set customers spent almost nothing after their first order. Most of them were buying for someone else. The customers who started with a $29 variety sampler, a product the brand barely advertised, came back at more than four times the rate and were worth more after 90 days, despite a first order less than half the size.
The founder's reaction was the one we hear most often: "We have been paying the most to acquire the customers who were least likely to come back."
That table is the subject of this article. It is one of the most useful analyses a DTC brand can run, it needs nothing more than an order export, and almost nobody does it because no standard dashboard shows it.
Why your product reports cannot answer this
Shopify, like every store platform, organises product reporting around products: units sold, revenue, returns, conversion rate on the product page. Those are the right numbers for merchandising and inventory. They answer "what sells?"
The question that matters for acquisition is different: "what kind of customer does each product create?" A product can sell brilliantly and still be a poor first purchase. It can be bought as a gift, bought once to try a trend, or bought by someone who only ever needed one. Another product can sell modestly and be the doorway through which most of your best customers walked in.
Your ad account cannot see this either. Meta optimises towards the purchase event and the purchase value it is told about. If the gift set produces a $64 order and the sampler produces a $29 order, the algorithm will happily push the gift set. It has no idea what happens on day 45.
What the analysis usually shows
Here is the coffee brand's table, simplified. It is an illustrative composite, but the shape is one we see again and again in food, supplements, skincare and pet brands.
Revenue per customer in the first 90 days, by the product in their first order (illustrative coffee brand)
Illustrative composite. 90-day revenue includes the first order.
| Label | 90-day revenue per customer |
|---|---|
| Variety sampler ($29) | $88 |
| Single-origin bag ($22) | $74 |
| Holiday gift set ($64) | $71 |
| Cold brew concentrate ($35) | $52 |
And here is the part that made the founder wince: where the ad budget was going.
Share of prospecting spend vs 90-day repeat rate, by entry product
Illustrative composite. Repeat rate is the share of new customers who placed a second order within 90 days.
| Label | Share of prospecting spend | 90-day repeat rate |
|---|---|---|
| Holiday gift set | 45% | 9% |
| Single-origin bag | 25% | 34% |
| Cold brew | 20% | 14% |
| Variety sampler | 10% | 41% |
The two lines run in opposite directions. The more budget a product received, the worse its customers were at coming back. That is not a coincidence. The products with the highest first-order value are often the ones bought for a specific occasion, and occasion buyers are exactly the people who do not need you again next month.
How to run the analysis, step by step
You can do this in a spreadsheet in an afternoon. Here is the method we use.
Step 1: Export the right orders
Export all orders from the last 12 to 18 months with customer ID or email, order date, line items with quantity and price, discount codes, refunds and order status. Exclude cancelled and fully refunded orders. If you sell on Amazon too, keep it separate for now: Amazon does not give you customer-level repeat data in the same way.
Step 2: Find each customer's first order
Sort by customer and date. The earliest order for each customer is their first order. Only keep customers whose first order falls at least 90 days before the end of your data, otherwise recent customers will look like non-repeaters simply because they have not had time.
Step 3: Assign an entry product
For single-item first orders, the entry product is that item. For multi-item first orders, use the highest-revenue line item, and also flag the order as "multi-item". Roll small SKUs up into their parent product or category so every group has at least 100 customers.
Step 4: Calculate value per customer for each entry product
For each entry product, calculate the numbers below. The last one is the one that matters most, and the one almost nobody calculates.
| Metric | How to calculate it | What it tells you |
|---|---|---|
| New customers | Count of customers whose first order contains this product | Whether the sample is big enough to trust |
| First-order value | Average net revenue of the first order | What the ad platform is optimising for |
| 90-day repeat rate | Share of these customers with a second order within 90 days | Whether the product creates a habit or a one-off |
| 90-day revenue per customer | All net revenue from these customers in their first 90 days, divided by customer count | Real early value, including the first order |
| 90-day contribution per customer | 90-day revenue minus product cost, shipping, fees, discounts and returns | What you can actually afford to pay to acquire them |
| Share of ad spend | Spend on ads where this product is the lead offer, divided by total prospecting spend | Where your money is going today |
That formula is why this analysis changes budgets. Each entry product has its own allowable CAC. A single account-wide CAC target treats them as equal, which means you overpay for some customers and underinvest in others.
Step 5: Look at the product path
Once you have the scorecard, look at what each group bought second. This is a simple two-way table: first product down the side, second product across the top, and the share of second orders in each cell.
| First product | Single-origin bag | Variety sampler | Cold brew | Subscription | Gift set |
|---|---|---|---|---|---|
| Variety sampler | 38% | 6% | 11% | 41% | 4% |
| Single-origin bag | 52% | 3% | 9% | 33% | 3% |
| Cold brew | 21% | 4% | 61% | 10% | 4% |
| Holiday gift set | 34% | 12% | 8% | 6% | 40% |
Read across each row. Gift set buyers who did come back mostly bought another gift set the next holiday season.
This table tells you how to sell, not just what to sell. Sampler buyers move to subscriptions. Cold brew buyers mostly rebuy cold brew and rarely explore. Gift set buyers come back, if at all, for the next gifting occasion. Each of those paths deserves a different post-purchase email flow and a different offer on the thank-you page.
Doing it inside Shopify
If you would rather not build a spreadsheet, you can get part of the way inside Shopify. The customer segment editor lets you build segments of customers who bought a specific product, and filter by number of orders. Create one segment per entry product with "number of orders is at least 2", and compare its size with the segment of everyone who bought that product. It is rougher than the full analysis, because it does not know which product came first, but it is enough to spot a dead end.
For the full version, a simple formula approach works in Google Sheets or Excel: one tab of orders sorted by customer and date, a helper column that marks the first order for each customer, a lookup that copies each customer's entry product onto all their later orders, and a pivot table of revenue and customer counts by entry product within 90 days. If you have a data person, this is a 20-line SQL query on your Shopify export.
The four kinds of entry product
When we run this across a catalog, products almost always fall into four groups. Naming them makes the decisions easier.
| Type | What the numbers look like | Typical examples | What to do |
|---|---|---|---|
| Gateway | Average or low first-order value, high repeat, high 90-day value | Samplers, starter kits, the everyday core product | Make it your lead prospecting offer and give it its own, higher CAC target |
| Dead end | Good first-order ROAS, low repeat, few cross-category second orders | Trend items, one-time-need products, very large pack sizes | Keep it in the catalog, reduce its share of prospecting spend, use it as an add-on |
| Gift | High first-order value, low repeat, seasonal spikes | Gift sets, bundles bought for others | Run it seasonally with gift-specific creative, and capture the recipient, not just the buyer |
| Loyal loop | Moderate repeat, but almost always the same product again | Refills, single-flavour consumables | Push subscription and replenishment reminders; do not expect it to grow basket size |
The mistake is not having dead ends or gift products. Every catalog has them, and they can be profitable. The mistake is letting them absorb most of the acquisition budget because their first-order ROAS looks best.
Why this matters more in 2026 than it did before
Two things have raised the stakes.
The ad decides the audience. Meta's delivery system now works out who to show an ad to mostly from the ad itself, with targeting kept broad. In practice, the product in your creative is your targeting. Show a gift set and Meta finds gift buyers. Show a sampler and it finds people curious enough to try your range. Choosing the lead product is therefore choosing which customers you will get, long before anyone checks out.
Optimisation is narrower than it looks. Ad platforms optimise to the purchase and its value on the day, inside an attribution window of days, not months. Since March 2026, Meta's click-through window also only counts conversions after a link click. Nothing in the platform will tell you that one product's buyers are worth twice another's at day 90. That has to come from your own order data.
What changes after you know the answer
You do not need to flip your whole budget overnight. Here is the order we usually recommend.
- Give your gateway product a fair test as a lead offer. Move 20% to 30% of prospecting budget to ads that lead with it. Run for three to four weeks. Expect first-order ROAS to drop. Judge the test on new customers acquired and their 60-day revenue, not on day-one ROAS.
- Set a separate CAC target per entry product. Use the allowable CAC formula above. A gateway product often justifies a CAC 20% to 40% higher than your blended target.
- Rebuild the post-purchase flow around the product path. If sampler buyers move to subscription, the second email should be about the subscription, not a generic "shop our bestsellers".
- Turn dead ends into add-ons. Offer them on the thank-you page and in the cart, where they lift order value without being asked to create loyal customers on their own.
- Re-run the analysis every quarter. New products, new creative and seasonality all change the answer.
80% of ad spend was on the product that ends the relationship
- What the dashboard said
- The peanut butter bites were the number one seller in Shopify with a 2.9x ROAS, so they got most of the budget.
- What was actually happening
- 72% of customers whose first order was the bites never ordered again. Customers who started with the dental chews went on to buy two or more products, and their 90-day revenue was close to double.
- Decision
- Test Test the chews as the lead ad product with their own CAC target, and move the bites to the cart as an add-on.
A product's ROAS tells you how well it sells. Its buyers' next 90 days tell you what it is worth.
The full story is in our case study on the pet treats brand. If you want the strategic side of choosing which product to lead with, including bundles and offer design, read our guide to finding your gateway product.
What the budget shift looked like in numbers
Back to the coffee brand. Here is what happened when they moved a quarter of prospecting spend from the gift set to the sampler over one month, outside the holiday season. The numbers are illustrative, but the trade-off is typical.
| Metric | Before | After | Change |
|---|---|---|---|
| First-order ROAS (new-customer revenue / spend) | 2.6x | 2.4x | Down 5% |
| New customers (Shopify) | 640 | 720 | Up 13% |
| Average first-order value | $52 | $44 | Down 15% |
| Projected 90-day repeat rate | 19% | 26% | Up 7 points |
| Projected 90-day contribution per customer | $33 | $38 | Up 15% |
| Projected 90-day contribution from the month's new customers | $21,100 | $27,400 | Up 30% |
Illustrative composite. Projections use each entry product's historical 90-day behaviour.
On the ad dashboard, the month looked worse: ROAS fell and so did order value. On the numbers that pay the bills, it was the best acquisition month of the year. This is why the decision cannot be made inside the ad account. The platform sees the first column. The business lives in the last row.
Common traps in a first-product analysis
- Too short a window. If your product lasts 60 days, a 30-day window makes every product look like a dead end.
- Ignoring discounts. A product that is usually bought with a 20% welcome code will show a different repeat pattern from one bought at full price. Split by discount use too. We cover why in our article on welcome discounts.
- Counting revenue, not contribution. A high-repeat product with thin margins can still be worth less than a lower-repeat product with fat ones.
- Forgetting returns. Some entry products have much higher return rates. Net them out. Our guide to returns by SKU shows how.
- Small samples. Below 100 customers per group, treat results as a hypothesis to test, not a fact.
The point: products create customers, not just revenue
Every product you advertise is a filter on who becomes your customer. Most brands choose that filter based on one number from the ad account, measured on the day of purchase. The brands that grow efficiently choose it based on what those customers do over the next three months.
That is the kind of connection we make in a Blindspot Snapshot: ads, orders, products and customer behaviour read together, so you know which product should carry your acquisition budget and which should not.
Questions founders ask
How many customers do I need for a first-product analysis?
Aim for at least 100 new customers per entry product in the period you analyse, and ideally 300 or more. Below about 100, one big repeat buyer or one bad week can swing the repeat rate by several points. Group small products into their category, or lengthen the date range, until each group has enough customers.
What if a customer's first order has several products?
Use two views. First, assign the customer to the highest-revenue item in the first order. Second, tag multi-product first orders as their own group ("bundle or multi-item"). Multi-item first orders almost always repeat better, so keeping them separate stops them from flattering whichever single product they happen to include.
Should I use 60, 90 or 180 days?
Use the window that matches your natural repurchase cycle and your cash. For consumables that run out in 30 to 45 days, 90 days captures two repurchase chances and is the best default. For slower categories like apparel or skincare tools, 180 days is more honest, but run the 90-day view too because that is the window that matters for cash payback.
Can Klaviyo or Shopify do this for me?
Partly. Shopify's customer cohort analysis report groups customers by acquisition month, not by first product. Klaviyo's predictive analytics estimate future value per customer once you have at least 500 customers with orders and 180 days of history, and you can segment by first product purchased. Neither gives you the full table of value, contribution and ad spend by entry product, so a spreadsheet or a simple SQL query is still the fastest route.
Does this matter if I mostly sell one product?
Yes, but the cut changes. Instead of comparing products, compare entry variants and offers: sizes, scents, single unit versus multi-pack, subscription versus one-time, and discounted versus full price. The same logic applies: the first purchase shapes the customer.