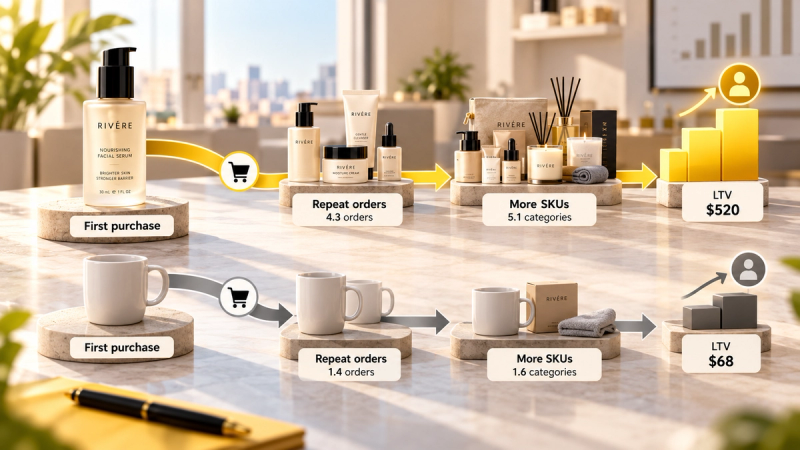
- A pet treats brand at about $16K a month put roughly 80% of its Meta budget behind its best seller, which had the best first-order ROAS in the account at 2.9x.
- When orders were grouped by each customer's first product, 72% of best-seller buyers never ordered again.
- Customers who started with a smaller product, dental chews, went on to buy two or more products and were worth close to double after 90 days.
- The decision was a test, not a switch: lead prospecting with the chews, keep the bites as an add-on, and judge the test on 60 and 90-day revenue per new customer.
- The signal was missed because Shopify ranks products by sales and Ads Manager by first-order ROAS. Neither shows what each product's buyers do next.
In this case study
The founder of a pet treats brand had a simple growth plan. The peanut butter bites were the number one product in Shopify, month after month. They had the best ROAS in the Meta account at 2.9x. Dogs loved them, reviews were glowing, and the product photographed beautifully. So the bites got about 80% of the ad budget, and every new creative test featured them.
The question that changed the plan was not about ads at all. It was: "Of the people whose first order was the bites, how many ever ordered again?" Nobody knew, because no report the brand used could answer it. When we found out, the answer was 28%. Nearly three in four best-seller customers were one-time buyers.
| Category | Pet treats and chews, sold DTC on Shopify |
|---|---|
| Size | About $16K a month in revenue |
| Main channel | Meta prospecting, plus email flows |
| Products | Peanut butter bites, dental chews, training treats |
| The question | Should we scale the bites harder before the holiday season? |
What the dashboards said
Every tool pointed the same way. Shopify's product report ranked the bites first by revenue and units. Ads Manager showed the bites ads at 2.9x ROAS, against roughly 2.3x for the few chews ads that had been tried. The email platform showed bites buyers opening and clicking at normal rates. Nothing looked wrong, because each tool was answering its own question correctly: what sells, what converts, what gets opened.
None of them answered the question that decides whether acquisition is building a business: what kind of customer does each product create?
How we connected the data
- Exported 12 months of Shopify orders with customer IDs, line items and discount codes.
- Tagged every customer with the product in their first order, keeping only customers whose first order was at least 90 days old.
- Calculated repeat rate, 90-day revenue and the most common second product for each entry product.
- Matched Meta spend to the lead product in each ad set, so every entry product had a share of spend next to its customer value.
What the connected data showed
Share of Meta spend vs share of first-time buyers who never reordered, by entry product (illustrative)
| Label | Share of Meta spend | Buyers who never reordered |
|---|---|---|
| Peanut butter bites | 80% | 72% |
| Dental chews | 12% | 51% |
| Training treats | 8% | 67% |
Revenue per customer in the first 90 days, by first product (illustrative)
Includes the first order. Chews buyers most often went on to buy the bites and training treats as well.
| Label | 90-day revenue per customer |
|---|---|
| Dental chews | $58 |
| Training treats | $35 |
| Peanut butter bites | $31 |
The bites were a fun, low-commitment treat: easy to try, easy to love, easy to forget. Dental chews solve a daily problem. Owners who start a dental routine for their dog keep buying, and once they trust the brand, they add the bites and training treats to the same order. The chews were the doorway. The bites were a pleasant room with no other exit.
Why it was missed
Shopify ranks products by revenue. It never shows what each product's buyers do next, so the product that wins the first order looks like the product to scale. Ads Manager optimises to the purchase on the day, inside an attribution window of days, not months. And because the bites had the most budget, they had the most first orders, which kept them at the top of the sales report, which kept their budget high. The loop was self-reinforcing, and nothing in it ever asked about the second order.
The decision
| Decision | What it meant in practice |
|---|---|
| Test | Lead prospecting with the dental chews, with their own ad set and their own cost target, for three to four weeks. |
| Fix | Move the bites to an add-on role: offered in the cart and on the thank-you page, not as the main ad offer. |
| Fix | Add a chews introduction to the bites buyers' post-purchase emails at around day 20. |
| Stop | Judging lead products on first-order ROAS alone. The test is read on 60 and 90-day revenue per new customer. |
What to watch
- New customers per week from Shopify, not Meta-reported purchases.
- Second-order rate at 30 days for chews-first customers acquired during the test, as the earliest signal.
- 60 and 90-day revenue and contribution per new customer, compared with bites-first customers from the same period.
- Add-on rate for the bites in the cart, to confirm they still sell without carrying acquisition.
How to check this in your own business
You need one order export and an afternoon. Group customers by their first product, compare repeat rate and 90-day revenue for each, and put each product's share of ad spend next to it. Our step-by-step guide to customer value by first product walks through the method, and finding your gateway product covers how to build offers around the answer.
If you would rather have it done for you, joined across your ads, orders and email data, that is what a Blindspot Snapshot does.
Questions founders ask
What is a first-product analysis?
It groups customers by the product in their first order and compares what each group does next: repeat rate, revenue and contribution over 60 to 180 days. It shows which products create returning customers and which create one-time buyers.
Why would a best seller have a low repeat rate?
Best sellers often get the most ad budget, which brings in the most first orders, which keeps them at the top of the sales report. That loop says nothing about repeat behaviour. Products that are cheap, novel or bought once to try tend to sell well and repeat poorly.
Should a brand stop advertising its best seller?
Usually not entirely. The better move is to test a different lead product with a fair budget, move the best seller into an add-on role, and judge both on 60 to 90-day revenue per new customer rather than first-order ROAS.
How long does a lead-product test take?
Three to four weeks of spend to acquire enough customers, then another 60 to 90 days to read their repeat behaviour. Early signals such as second-order rate at 30 days and average order value usually show the direction within six weeks.
Illustrative case: a composite built from patterns we see in brands at this stage, with details changed. It is not a single named client result.