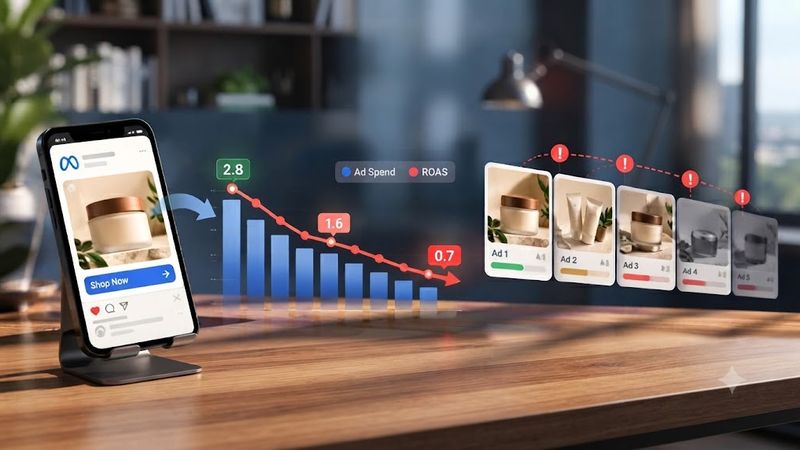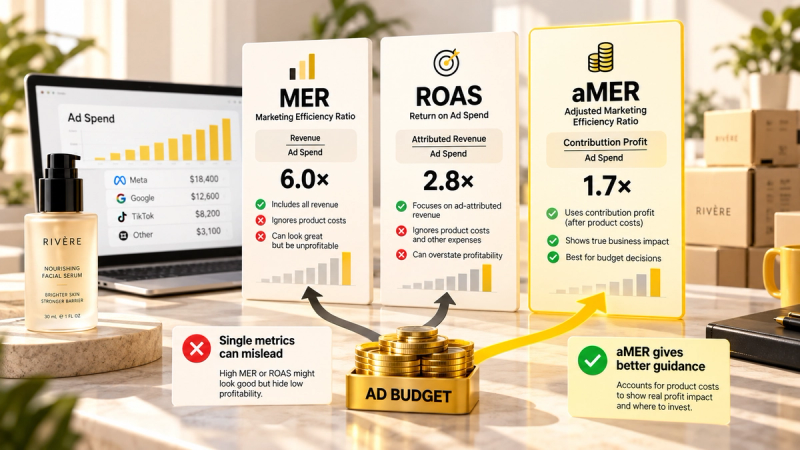
- Platform ROAS tells you which sales an ad platform can connect to its ads. Incrementality tells you which sales would not have happened without them. Scaling decisions need the second.
- A geo holdout (switching a channel off in a set of states or regions and comparing with the rest) is the most practical test for brands spending roughly $20k a month or more on a channel.
- Measure the outcome in total orders from Shopify and, if you sell there, Amazon. Measuring in the platform's own numbers defeats the purpose.
- Divide incremental ROAS by platform ROAS to get a correction factor. Use it to read daily platform numbers until the next test.
- Average ROAS and marginal ROAS are different. A scale test tells you what the next $10k buys, which is the number you actually need before raising budget.
In this article
A founder spending $60,000 a month on Meta asks a question every founder eventually asks: "If I switched it all off tomorrow, how much would I actually lose?" Ads Manager says 3.0x ROAS, so the implied answer is $180,000 a month. The agency agrees. Nobody has ever checked.
So they test it. For four weeks, Meta goes dark in a set of states that normally produce a fifth of sales, while the rest of the country carries on as usual. The answer: Meta was causing real sales, but about 44 cents for every dollar it claimed. The channel was worth keeping. The plan to double it was not. And because the brand also sold on Amazon, part of the effect only showed up there, which no ad dashboard would ever have revealed.
That is what incrementality testing does: it replaces "what the platform can connect to its ads" with "what would not have happened without them". You do not need a seven-figure budget or a data science team to do it. This guide shows how.
A founder spending $60,000 a month on Meta asks a simple question: if I switched this off, how much revenue would I lose? Meta's dashboard says the answer is $180,000 a month, because it reports a 3.0x ROAS. The honest answer is almost always lower, sometimes much lower, and occasionally higher once Amazon and retail sales are counted.
Incrementality testing is how you get the honest answer. It sounds like something reserved for brands with data science teams and seven-figure budgets. It is not. The methods below work for brands doing $100k to $500k a month, as long as you pick the right question and keep the test clean.
Why platform ROAS is not the answer
Ad platforms report conversions they can connect to an ad interaction inside their attribution window. On Meta, new website conversion ad sets default to a 7-day click, 1-day engage-through and 1-day view-through window. Engage-through replaced the older engaged-view setting in March 2026 and now includes likes, comments, shares, saves and other non-link interactions followed by a purchase within a day.
Every one of those rules can count a customer who was already going to buy. Someone who searched your brand on Google, then scrolled past your ad and liked it, then bought, is a Meta conversion. Retargeting to people who already have items in their cart is especially prone to this, because those people are the most likely to buy regardless.
Meta also offers an incremental attribution setting, rolled out in 2025, which optimises and reports using a model of which conversions were likely caused by ads. It is a useful step, but it is still the platform grading its own work with its own model. A test you control is the only way to check it.
| Method | What it answers | Rough minimum | Duration | Main risk |
|---|---|---|---|---|
| Pause test | What happens to total sales if we stop a channel | Any budget | 2 to 3 weeks | Seasonality and promotions distort the before and after |
| Geo holdout | How many sales a channel causes in regions where it runs | About $20k a month on the channel | 3 to 6 weeks plus 2 week lag check | Picking regions that do not behave alike |
| Geo scale test | What extra spend buys at the margin | About $30k a month on the channel | 4 to 6 weeks | Spending the test budget too thinly to see an effect |
| Platform lift study | The platform's own randomised test of exposed vs unexposed users | Varies by platform and rep access | 2 to 4 weeks | Measures only that platform, often in its own numbers |
Minimums are working rules of thumb, not platform requirements. Noisy sales need bigger budgets or longer tests.
Start with one question
Most failed tests fail because they try to answer three questions at once. Pick one:
- Does this channel work at all? Use a geo holdout. Switch it off in a group of regions.
- Does more spend still pay? Use a geo scale test. Increase spend in a group of regions by 50% to 100%.
- Is this campaign type doing anything? Retargeting, brand search and Advantage+ catalogue campaigns are the usual suspects. Hold out only that campaign type.
Write the question and the decision rule down before you start. For example: "If Meta's incremental ROAS on first orders is below 1.4x, we cut prospecting by 30% and move the money to YouTube for a matching test."
How to run a geo holdout, step by step
1. Choose the outcome you will measure
Use total orders or revenue by ship-to state (or metro area if you have enough volume) from Shopify. If you sell on Amazon, add Amazon sales by state from your business reports. Ads optimised for your website regularly move Amazon sales too, and ignoring that makes social and video look worse than they are. We cover how big that effect can be in The Amazon halo effect.
2. Pull at least 8 to 12 weeks of daily history
You need enough history to see how regions normally move together. Holidays and big promotions in the history are fine as long as they happened everywhere at once.
3. Pick test and control regions
Choose a group of states that together make up roughly 15% to 25% of sales. The control group is everything else. The two groups should have tracked each other closely in the history. Open-source tools such as Meta's GeoLift use a method called synthetic control to build a weighted control that matches the test regions, and include power calculators that tell you whether your test can detect the effect you care about.
4. Make the change and freeze everything else
Exclude the test regions from the channel's targeting (for a holdout) or raise budgets there (for a scale test). Then freeze anything else that could move sales unevenly across regions: regional promotions, new retail doors, influencer posts aimed at one city.
5. Run for at least three weeks, then watch the lag
Most tests need three to six weeks. Keep measuring for two weeks after the test ends. Some customers see an ad and buy ten days later, and switching off a channel can take time to show in sales.
6. Read the result against the decision you wrote down
| Line | Value |
|---|---|
| Monthly Meta spend, whole US | $60,000 |
| Test regions' share of normal sales | 20% |
| Meta spend removed from test regions over 4 weeks | $12,000 |
| Expected revenue in test regions (synthetic control) | $120,000 |
| Actual revenue in test regions (Shopify plus Amazon) | $104,000 |
| Incremental revenue caused by Meta | $16,000 |
| Incremental ROAS | 1.33x |
| Meta-reported ROAS for the same period | 3.0x |
| Correction factor | 0.44 |
Illustrative numbers. Revenue includes Amazon sales shipped to the test states.
Weekly revenue in test regions, Shopify plus Amazon, vs the synthetic-control forecast ($K, worked example)
The gap between the lines, $16K over four weeks, is the revenue Meta was causing in those regions.
| Label | Expected without the test (forecast) | Actual with Meta switched off |
|---|---|---|
| Week 1 | $30K | $26.5K |
| Week 2 | $30K | $25.5K |
| Week 3 | $30K | $26K |
| Week 4 | $30K | $26K |
Platform-reported ROAS vs incremental ROAS for the same period (worked example)
Correction factor 0.44. Your account may sit above or below 1.0; the only way to know is to test.
| Label | ROAS |
|---|---|
| Meta-reported ROAS | 3x |
| Incremental ROAS from the holdout | 1.33x |
In this example Meta is not useless. It caused about $1.33 of revenue per dollar. But with a contribution margin of 55%, break-even ROAS is 1.82x, so first orders alone do not pay for the spend. The next question is whether repeat purchases from those customers close the gap within your payback window. That is a cohort question, and we explain how to read it in MER vs ROAS vs aMER.
Average ROAS vs marginal ROAS
A holdout tells you the average effect of your current spend. It does not tell you what the next $10,000 buys. The first dollars in any channel reach the easiest customers. Each extra dollar reaches people who are a bit less interested, so the return on the extra spend is lower than the average.
That is why a founder can see 2.5x ROAS on $40k a month, scale to $80k, and watch total revenue barely move. The average was fine. The margin was not.
| Monthly spend | Average iROAS | Return on the extra spend |
|---|---|---|
| $40,000 | 2.1x | Not applicable |
| $60,000 | 1.8x | 1.2x on the extra $20k |
| $80,000 | 1.55x | 0.8x on the extra $20k |
Illustrative. At $80k, the last $20k returned 80 cents per dollar in revenue, before product costs.
Incremental return on each extra $20K of monthly spend, from the scale test above
Average iROAS at $80K was still 1.55x. Averages hide where the curve bends.
| Label | Return on the extra spend |
|---|---|
| $40K to $60K | 1.2x |
| $60K to $80K | 0.8x |
A geo scale test measures this directly. Double spend in the test regions and compare with the control. The lift, divided by the extra spend, is your marginal return. If it is below break-even, more budget will make the business bigger and less profitable at the same time.
The pause test: cheap, useful, easy to fool yourself with
Switching a channel off everywhere for two or three weeks is the simplest test. It works best for small channels, retargeting and brand search. It fails when:
- The pause overlaps with a sale, a launch, a holiday or a stockout.
- You compare the pause with the previous two weeks without checking last year's pattern for the same weeks.
- Another channel quietly picks up the demand (brand search often rises when social is paused, then gets credited in Google).
If you run one, compare total revenue and new customer counts with the same weeks last year, adjusted for your growth rate. And watch new customers, not just revenue. Returning customers are rarely affected by a two-week pause.
Illustrative cases
Retargeting was 30% of the Meta budget and almost none of the effect
- What the dashboard said
- Retargeting campaigns reported a 6.8x ROAS, the best in the account. The agency wanted to add budget.
- What was actually happening
- A four-week geo holdout of retargeting only showed no measurable difference in total orders between test and control regions. The retargeted audience was people with items in cart and recent site visitors, who were already coming back through email and brand search.When prospecting was held out separately in a later test, it showed a clear lift.
- Decision
- Stop Cut retargeting to a small always-on budget for new product launches only, and move about $17k a month into prospecting and creative testing.
The highest platform ROAS in an account is often the least incremental, because it goes to people who were closest to buying anyway.
YouTube looked like a loss until Amazon was counted
- What the dashboard said
- YouTube reported under 1x ROAS on website sales. The founder was ready to stop it.
- What was actually happening
- A geo holdout that measured Shopify and Amazon sales together showed YouTube's incremental ROAS at about 1.9x, with more than half the lift landing on Amazon. Website-only measurement had been hiding most of the effect.
- Decision
- Scale Keep YouTube, increase spend 25% in a scale test, and move the success metric to combined Shopify plus Amazon sales by region.
If you sell in more than one place, measure every place the ad could send someone. Otherwise video and social will always look worse than they are.
When not to test
Testing has a cost: lost sales in the holdout, time, and the risk of reading noise as a result. Skip formal tests when:
- The channel spends under roughly $10k to $20k a month. The effect will be too small to see against normal sales noise.
- Your sales are very lumpy (big wholesale orders mixed into DTC, frequent stockouts, one viral week a quarter).
- You cannot freeze promotions for a month.
In those cases, track blended numbers (MER and new customer counts) week by week, run a post-purchase survey, and make changes in large, clearly dated steps so you can read them afterwards.
What changed in 2025 and 2026
Incrementality used to be a big-brand luxury. Three changes have brought it within reach of smaller brands and made it more necessary.
- Meta now offers an incremental attribution model. Introduced in 2025, it optimises towards conversions Meta's models predict were caused by the ad. It is a useful step, but it is still the platform grading its own work. Treat it as a better optimisation signal, and keep your own holdouts as the referee.
- Click-through attribution changed in March 2026. Meta now counts click-through conversions only after a link click, with engagement-driven conversions moved to a separate window. Any correction factor you calculated before March 2026 needs to be re-measured against the new reporting.
- Platform ROAS is not always too high. Haus analysed 640 Meta experiments on its platform and found that, for those mostly large brands, Meta drove about $1.15 of incremental DTC revenue for every $1.00 reported on a 7-day click basis. Smaller accounts, retargeting-heavy accounts and brands with strong organic demand often land well below 1.0. That spread is exactly why you test rather than assume.
What to do this week
- Write down your biggest open question about paid media and the decision each answer would lead to.
- Export 12 weeks of daily orders by ship-to state from Shopify, and Amazon if relevant.
- Check how evenly your top channel's spend is spread across states in its breakdown report.
- Pick test regions making up 15% to 25% of sales that tracked the rest of the country closely.
- Put the test on the calendar for a quiet month with no planned promotions.
- Agree the decision rule with whoever runs your ads before the test starts.
Questions founders ask
What is a good incremental ROAS?
It depends on your contribution margin. Incremental ROAS on first orders needs to be above 1 divided by your contribution margin to pay back immediately. At a 50% margin that is 2.0x. Many brands accept a lower first-order number if repeat purchases pay back the rest within their chosen window, often 60 to 180 days.
How much budget do I need for a geo holdout test?
As a working rule, the channel should spend around $20,000 a month or more, and the test regions should produce enough daily orders that normal day-to-day swings are small compared with the effect you want to detect. Power calculators in tools like GeoLift will tell you before you start whether your test can see the effect.
Is Meta's incremental attribution setting the same as an incrementality test?
No. It is a model inside Meta that estimates which conversions its ads caused and uses that for optimisation and reporting. It can be a better default than standard attribution, but it is not an independent test. A geo holdout measured in your own Shopify and Amazon data is.
How often should we run incrementality tests?
Most brands at this size do well with one test a quarter on their largest channel, plus a test whenever spend changes by more than about 50% or a new campaign type starts taking a large share of budget.
Can I test more than one channel at once?
You can, with separate groups of regions for each channel, but it needs more volume. For most brands under $500k a month, one channel at a time gives cleaner answers.