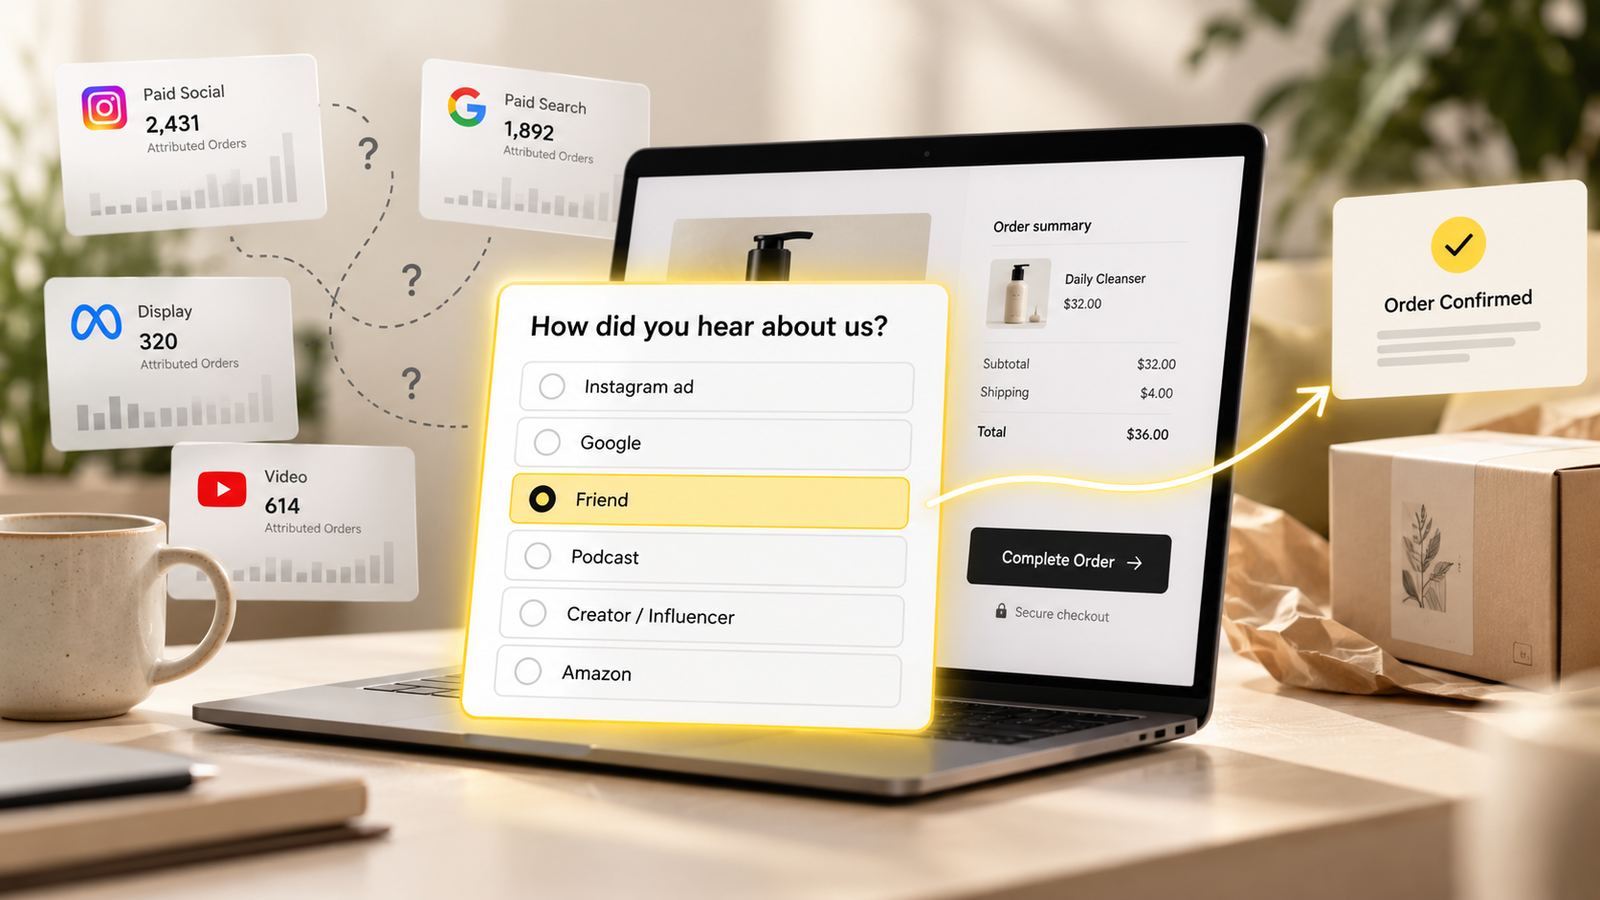
- Click-based attribution only sees channels that produce a trackable click. Podcasts, creators, word of mouth, TV, retail displays and AI assistants mostly show up as "direct" or branded search.
- A one-question survey on the order confirmation page, shown only to new customers, fills that gap. Survey providers report response rates around 50% when it appears right after checkout.
- The survey is a directional signal, not a precise count. People remember the most memorable touch, and "Google" often means "I searched your name after seeing you somewhere else".
- Compare survey share with platform-claimed share for each channel. Large gaps in either direction are where your budget decisions are most likely wrong.
- Add an answer for AI assistants now. It is a growing discovery route and almost invisible in analytics.
In this article
A wellness brand sponsored a podcast for three months and cancelled it. The promo code had been used about 60 times. At the price of the sponsorship, that worked out to an acquisition cost nobody could defend. The founder chalked it up as a lesson: podcasts do not work for us.
A month later they added one question to the order confirmation page: "How did you hear about us?" The podcast was the second most common answer among new customers. Listeners had heard the host read, remembered the brand name, and searched for it later without a code. Google took the credit as branded search. The channel that "did not work" had been quietly bringing in one new customer in eight.
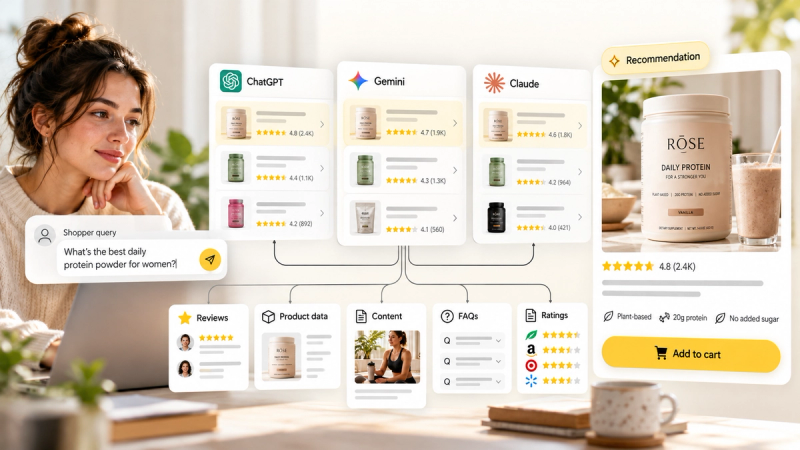
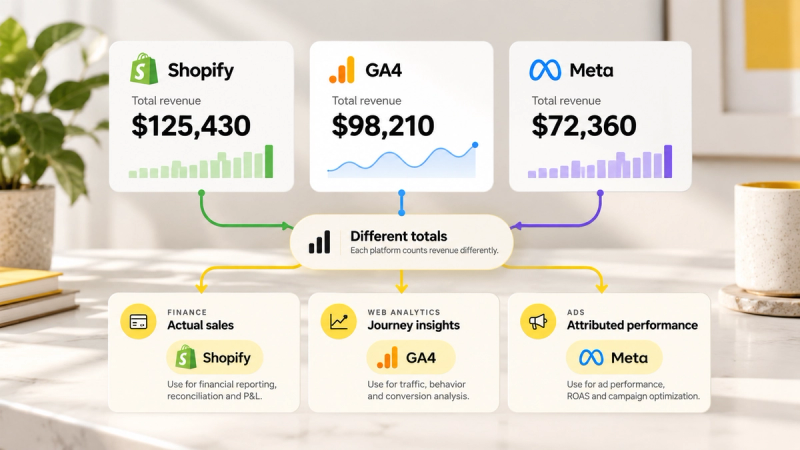
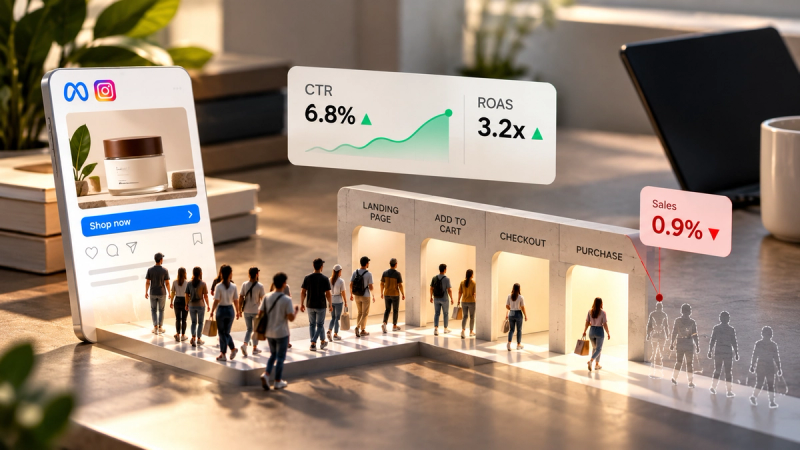
Every attribution tool depends on clicks, cookies and pixels. That works well for channels built around clicks, like search and paid social. It barely works for the channels where many consumer brands actually get discovered: a podcast host's recommendation, a friend's bathroom shelf, a creator's unpaid video, a TV spot, a mention in an AI assistant's answer.
Those customers arrive later, usually by typing your name into Google or straight into the browser. Your analytics call them "direct" or "branded search", and the channel that actually introduced them gets no credit. A single question after checkout is the cheapest way to see them.
Why attribution misses so much
| Discovery route | What analytics usually records | Survey picks it up? |
|---|---|---|
| Paid social ad clicked | Meta, TikTok, etc. | Yes |
| Paid social ad seen, bought days later by searching your name | Branded search or direct | Yes |
| Podcast host read | Direct or branded search, sometimes a code | Yes |
| Creator content (paid or organic) | Direct, branded search, sometimes a code | Yes |
| Friend or family recommendation | Direct | Yes |
| TV, streaming or out-of-home | Direct or branded search | Yes |
| Recommendation from an AI assistant | Direct, or a referral from the assistant in some cases | Yes, if the option exists |
| Amazon purchase after any of the above | Not visible to your site at all | No, unless surveyed on Amazon |
Designing the survey
Good survey data comes from a few careful choices.
- Ask new customers only. Returning customers answer "I already buy from you", which tells you nothing about acquisition.
- Ask one question. Every extra question lowers the response rate. Follow-up questions should only appear for specific answers (for example, "Which podcast?").
- Randomise answer order. People pick options near the top more often. Randomising removes that bias.
- Use the words customers use. "Instagram" and "Facebook" as separate options, not "Meta". "A friend or family member", not "word of mouth".
- Always include "Other" with a text box. Read those answers monthly. New channels show up there first.
- Add an AI assistant option. For example: "ChatGPT, Claude, Gemini or another AI assistant". Many brands have no idea how often this answer appears.
- Keep the options stable. Changing options breaks your trend line. Add new options rarely and date the change.
| Answer option | Follow-up question (only if chosen) |
|---|---|
| Ad, or a post from someone I follow? | |
| None | |
| TikTok | Ad, or a video from someone I follow? |
| YouTube | Which channel? |
| Podcast | Which podcast? |
| Friend or family member | None |
| Google search | None |
| AI assistant (ChatGPT, Claude, Gemini, other) | None |
| TV or streaming | None |
| In a store | Which store? |
| Article or review site | Which site? |
| Other | Text box |
Reading the answers without fooling yourself
Survey answers have their own biases. Knowing them is what makes the data useful.
- "Google" is usually not where they heard about you. Most people search for a brand they already heard of somewhere else. Treat "Google search" as capture, not discovery, unless your non-brand search spend is large.
- People remember the most memorable moment, not the first or the last. A podcast recommendation beats the third Instagram ad in memory.
- Instagram and Facebook get mixed up. Treat them together when comparing with Meta.
- Response rates differ by segment. Mobile shoppers and gift buyers may answer less. Check response rate by device and order value before you trust small differences.
Comparing surveys with platform attribution
The most useful view puts two numbers side by side for each channel: the share of new customers the platforms claim, and the share of new customers who named that channel in the survey. Where the two disagree sharply, settle it with a test, as described in Incrementality testing on a small budget.
| Channel | Platform-attributed share of new customers | Survey share (of respondents) | Reading |
|---|---|---|---|
| Meta (Instagram plus Facebook) | 46% | 31% | Platform likely over-credited, partly retargeting and view-through |
| Google (brand plus non-brand) | 24% | 14% | Mostly capture of demand created elsewhere |
| Podcast | 3% (code redemptions) | 12% | Heavily under-credited |
| Friend or family | Not tracked | 19% | Large, invisible, worth a referral programme |
| TikTok (mostly organic) | 2% | 9% | Organic content working without ad spend |
| AI assistant | Not tracked | 4% | Small, growing, worth watching |
| Other | 25% (direct, email, other) | 11% | Includes some returning customers who slipped through |
Illustrative. Platform shares can add to more than 100% when channels double-count, and survey shares are based on respondents only.
Share of new customers by channel: platform attribution vs post-purchase survey (illustrative month)
The biggest gaps, in either direction, are where budget decisions are most likely wrong.
| Label | Platform-attributed share | Survey share |
|---|---|---|
| Meta | 46% | 31% |
| 24% | 14% | |
| Podcast | 3% | 12% |
| Friend or family | 0% | 19% |
| TikTok | 2% | 9% |
| AI assistant | 0% | 4% |
In the example above, if the podcast cost $18,000 for the month, code redemptions suggest a cost of $300 per new customer (60 codes). If survey respondents are representative, about 12% of the 2,000 new customers, roughly 240 people, came from the podcast, for about $75 each. Neither is exact. Together they say the podcast is very likely far better than the codes suggest, which is exactly the kind of question worth a proper test.
Illustrative cases
The podcast that "did not work" was the second-best channel
- What the dashboard said
- A six-month podcast sponsorship showed a 1.1x return on code redemptions. The founder planned to cancel it.
- What was actually happening
- In the post-purchase survey, customers naming the podcast outnumbered code redemptions roughly four to one. Branded search and direct traffic rose on the days episodes aired. Most listeners had simply typed the brand name rather than remembering the code.
- Decision
- Test Keep the sponsorship for one more quarter, add a memorable vanity URL, and run a geo or timing test around episode drops to confirm the effect.
Codes measure the listeners who remembered a code. Surveys measure the listeners who remembered you.
One in five customers came from friends, and nobody was asking them to
- What the dashboard said
- Meta claimed about half of new customers. The plan was to raise Meta spend by 30%.
- What was actually happening
- The survey showed 23% of new customers heard about the brand from a friend or family member, the second-largest source. The brand had no referral programme and no post-purchase message encouraging customers to share.
- Decision
- Scale Launch a simple give-and-get referral offer in the post-purchase flow before increasing Meta spend, and track the friend or family share monthly.
The survey often shows your cheapest growth channel is one you are not paying for yet.
What to do this week
- Add a one-question survey to the order confirmation page, for new customers only, with randomised answers.
- Include separate options for podcasts, friends, creators and AI assistants, plus "Other" with a text box.
- After four weeks, compare survey shares with platform-claimed shares for each channel.
- Calculate the code multiplier for any podcast or creator programme.
- Read the "Other" answers and look for channels you did not know about.
- Pick the biggest gap between survey and platform numbers and plan a test to settle it.
Questions founders ask
How accurate are post-purchase attribution surveys?
They are accurate about what customers remember, which is not always the full path. They are best used as a directional signal to compare channels and spot under-credited ones, and paired with incrementality tests for large decisions.
What response rate should I expect?
Survey providers report response rates around 50% for single-question surveys shown on the order confirmation page. Rates are lower for surveys sent later by email.
Should I ask returning customers how they heard about us?
Not for acquisition analysis. Returning customers usually answer with how they came back this time or that they already know you. Show the question to first-time buyers only.
How do I measure podcast advertising?
Use codes and vanity URLs, but do not rely on them alone, because many listeners search your brand name instead. Compare survey mentions with code redemptions to estimate a multiplier, and watch branded search and direct traffic around episode dates.
Should I add AI assistants as a survey option?
Yes. Customers increasingly discover products through AI assistants, and these visits often appear as direct traffic. A dedicated answer option is the simplest way to see whether it is happening for your brand.