- A skincare brand at about $110K a month spent $18K on a creator campaign. Tracked links and discount codes showed 11 orders, close to zero ROAS. The plan was to cut the program.
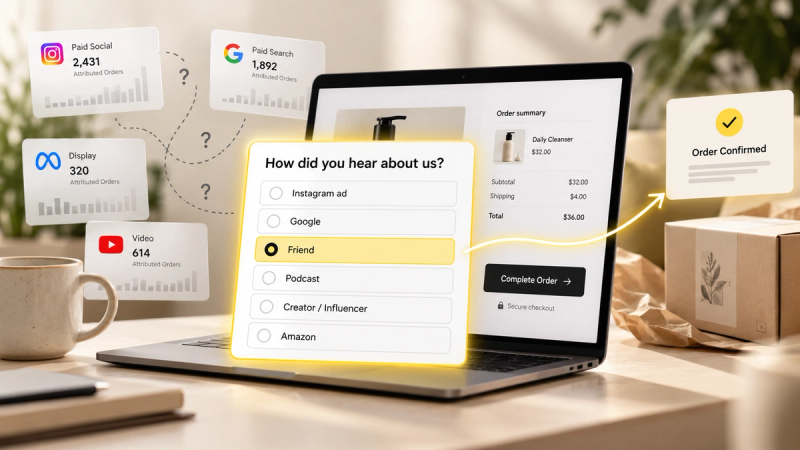
- In the post-purchase survey, 17% of new customers in the campaign month named one of the creators, and branded search rose sharply on the days videos went live.
- A two-region comparison suggested the campaign drove roughly 300 additional new customers in the month, a cost per new customer below the brand's Meta average.
- The decision: keep the strongest creators, measure them with surveys, branded search and periodic regional tests, and run their best posts as paid partnership ads.
- Codes and links measure the smallest, most deal-driven slice of creator impact. Most viewers buy later, by searching your name.
In this case study
The spreadsheet looked damning. Twelve creators, $18,000 in fees and product, a month of posts. Tracked links and discount codes accounted for 11 orders. On paper, the creator program had a ROAS close to zero, and the founder of a skincare brand had a meeting booked to cancel it.
Two other numbers told a different story. In the post-purchase survey for that month, 17% of new customers named one of the creators as how they heard about the brand. And branded search for the brand's name had jumped on the days the biggest videos went live. Viewers were buying. They just were not clicking links or typing codes.
| Category | Skincare, DTC on Shopify |
|---|---|
| Size | About $110K a month in revenue, around 1,800 new customers a month |
| Creator campaign | 12 creators, $18K for one month, codes and tracked links |
| The question | Should we cut the creator program? |
What the connected data showed
New customers attributed to the creator campaign in the month (illustrative)
Survey: 17% of about 1,800 new customers, scaled from respondents. Regional estimate: creators' audiences were concentrated in two regions compared with similar regions.
| Label | New customers |
|---|---|
| Codes and tracked links | 11 |
| Post-purchase survey | 306 |
| Regional comparison (estimate) | 290 |
Daily branded search clicks, indexed to the previous month's average = 100 (illustrative)
| Label | Branded search index |
|---|---|
| Day 1 | 104 |
| Day 5 | 112 |
| Day 9 (big post) | 196 |
| Day 13 | 148 |
| Day 17 (big post) | 211 |
| Day 21 | 156 |
| Day 25 | 139 |
| Day 29 | 131 |
No single method was precise. Survey answers are self-reported, and people remember the most memorable touch. The regional comparison was rough, because creators' audiences are not neatly split by geography. But all three non-code signals pointed the same way, and none of them was anywhere near 11.
Why it was missed
Codes and links capture people who buy immediately, on the same device, and remember to use them. Most viewers do none of those things: they watch on their phone, think about it, and search the brand name later, often on another device. Codes also leak; UGCBloom describes coupon sites driving sudden spikes in code use that have nothing to do with the creator. The result is that code counts both undercount real impact and credit the wrong people.
The decision
| Decision | What it meant in practice |
|---|---|
| Stop | Cancelling the program on code and link counts. |
| Scale | Run the four best-performing posts as paid partnership ads, measured on Shopify new customers. |
| Fix | Keep the five creators most often named in the survey; replace the rest. |
| Test | A quarterly regional test, with creators concentrated in matched regions, to measure lift more precisely. |
How to check this in your own business
Add creator options to your post-purchase survey, plot branded search against post dates, and plan a simple regional test. Then check whether creator-driven customers come back, as in cohort analysis by channel. A Blindspot Snapshot brings these signals together so creator spend is judged on what it actually does.
Questions founders ask
How do you measure influencer or creator marketing ROI?
Use several signals together: a post-purchase survey with creator or platform options, branded search volume around post dates, new-customer counts in Shopify, and, where possible, a regional or time-based test. Tracked links and codes capture only a small share of creator-driven sales.
Why do discount codes undercount creator sales?
Many viewers do not buy immediately. They remember the brand and search for it later, often on a different device, without a code. Codes can also leak to coupon sites and be used by people who never saw the creator.
Should creator content be run as paid ads?
Often yes. Running a creator's best-performing post as a partnership ad lets you reach far more people with content that already proved it persuades, and lets you measure performance with the same tools as other paid ads.
Illustrative case: a composite built from patterns we see in brands at this stage, with details changed. It is not a single named client result.